


ULTRA.F/DigitalVision via Getty Images
Investment Thesis
Amcor plc’s (NYSE:AMCR) growth over the past 6 years was driven by acquisitions. While there were mixed signals about its track record in improving operating and capital efficiencies, there was a top-line and bottom-line growth. There were also uptrends on the various return metrics.
The Group is financially sound with a very low Reinvestment rate. A valuation assuming zero or low Reinvestment rates showed that there is more than a 30% margin of safety. I would consider Amcor an investment opportunity.
Background
Amcor is a global leader in developing and producing packaging products worldwide, with 218 locations in 41 countries. In 2023, North America and Western Europe accounted for 49% and 23% respectively of its revenue.
Amcor started in the paper packaging business. Through several acquisitions and divestments over many years, it is today focused on flexible and rigid plastic packaging.
- The Flexibles Segment is “…one of the world’s largest suppliers of plastic, aluminum, and fiber-based flexible packaging.” In 2023, this segment accounted for about 76% of the consolidated revenue.
- The Rigid Packaging Segment supplies rigid packaging containers and related products. In 2023, this segment accounted for about 24% of the consolidated revenue.
Amcor has a June financial year-end. In my analysis, I covered its performance from 2017 to 2024. I used the LTM March 2024 results to represent the 2024 performance.
Operating trends
To get an overview of the performance, I look at 2 groups of metrics.
- The left part of Chart 1 tracks the trends for revenue, PAT, and gross profitability (gross profit/total assets).
- The right part of Chart 1 tracks 3 return metrics – Operating return (NOPAT/Total Capital Employed), ROE, and ROA.
You can see that there is a “discontinuity” in the trends for the various metrics in 2019. This was because of the acquisition of Bermis Company Inc. which led to a substantial increase in assets and equity.
- Total assets went from USD 9.1 billion in 2018 to USD 17.2 billion in 2019.
- Equity increased from USD 0.7 billion in 2018 to USD 5.7 billion in 2019.
There was also a drop in PAT in 2019 due to the merger and restructuring charges. Given these changes, it is more meaningful to look at the performance from 2019 to 2024.
Chart 1: Performance Index and Returns (Author)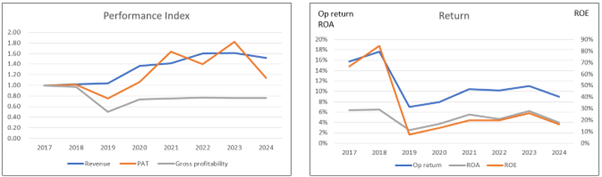
Note to Performance Index chart. To plot the various metrics on one chart, I have converted the various metrics into indices. The respective index was created by dividing the various annual values by the respective 2017 values.
From 2019 to 2024:
- Revenue and PAT grew at 7.8% CAGR and 8.7% CAGR, respectively.
- The drop in PAT in 2024 was partly due to lower revenue, higher interest expenses as well a restructuring charge.
- While gross profitability improved in 2020 compared to 2019, there was not much improvement since then.
- There were uptrends for the 3 return metrics.
- Over this period, operating return averaged 9.3% while ROE averaged 17.1%. Given the current 7.2% WACC and 8.6% cost of equity, Amcor created shareholders’ value.
Table 1: Cost of funds (Various)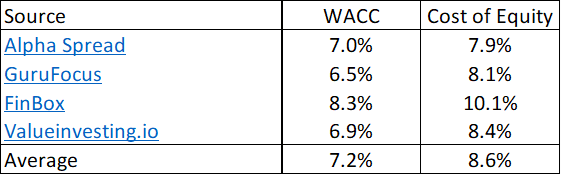
Note: Based on the first page results of a Google search for “AMCR WACC”.
To get a better understanding of operations, I broke down the operating profits into various components. Refer to the left part of Chart 2. Note that in the Chart, the gap between revenue and total cost (fixed cost + variable cost) represents the operating profit. I also carried out a DuPont analysis of the operating return as shown in the right part of Chart 2.
The contribution margin was relatively stable, with an average of 24% from 2019 to 2024. The proportion of fixed cost to total cost was also comparatively stable, averaging about 15% over the past 6 years. Both of these meant that as revenue grew, there was a corresponding growth in the operating profit.
The DuPont analysis showed that the improvement in Operating return was driven more by the improving asset turnover rather than the operating margin.
I have earlier mentioned that gross profitability was relatively flat. This was in contrast to the asset turnover. This can be explained as follows:
- Revenue increased faster than total assets, resulting in improving asset turnover.
- This revenue growth meant growth in gross profits. However, there was not much growth in gross profit margin, i.e. lower growth in gross profits compared to revenue.
- The increase in gross profits just matched the increase in total assets. This in turn led to a flat gross profitability.
Chart 2: Op Profit Profile and DuPont Analysis (Author)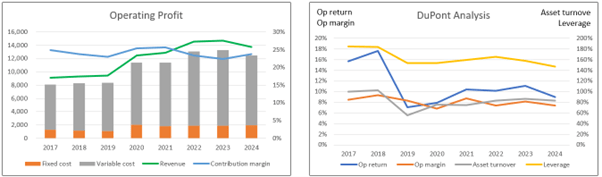
Note to Op Profit Profile. I broke down the operating profits into fixed costs and variable costs.
- Fixed cost = SGA, Depreciation & Amortization and Others.
- Variable cost = Cost of Sales – Depreciation & Amortization.
- Contribution = Revenue – Variable Cost.
- Contribution margin = Contribution/Revenue.
Peer comparison
I compared Amcor’s performance with some listed global peers based on 2 metrics – Return on capital and gross profit margin. Refer to Chart 3.
- I would rate Amcor’s return on capital as the panel average.
- I would put Amcor’s gross profit in the lower half of the panel performance.
Chart 3: Peer comparison (Tikr.com)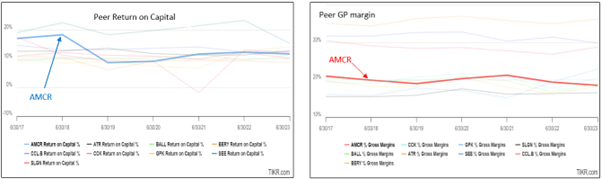
Notes to Chart 3: The peers refer to the following:
- ATR – AptarGroup
- BALL – Ball Corporation
- BERY – Berry Global Group
- CCL.B – CCL Industries
- CCK – Crown Holdings
- GPK – Graphic Packaging
- SEE – Sealed Air Corporation
- SLGN – Silgan Holdings
What are the key takeaways from the analysis so far?
- While there were top-line and bottom-line growths, there were mix-signals when it came to operating and capital efficiencies. Asset turnover improved but gross profitability and leverage were flat. Fixed costs seemed to be well controlled.
- Amcor return on capital and gross profit margin are not industry-leading. But there are peers which did worse.
Financial position
I would assess Amcor as financially sound based on the following points.
It had USD 461 million in cash and short-term investments as of the end of Mar 2024. This was about 3% of its total assets.
From 2017 to 2024, it generated positive cash flow from operations every year. During this period, it generated USD 9.5 billion in cash flow from operations compared to the net income of USD 5.7 billion. This is a good cash conversion ratio.
It has a negative overall Reinvestment rate (Reinvestment/NOPAT) from 2017 to 2024.
I defined Reinvestment = CAPEX + Acquisition – Divestiture – Depreciation & Amortization + Changes in Net Working Capital.
The negative Reinvestment rate was because the Depreciation & Amortization, and Divestitures far exceeded what was spent on CAPEX + Acquisition and Net Working Capital. This meant that:
- The company did not need to spend much of its cash flow from operations to grow the business.
- A large proportion of its NOPAT could be converted to free cash flow.
Note that the above Reinvestment did not include the Bermis acquisition which was “paid” via share issuance.
It also has a good capital allocation track record as can be seen from Table 2. It was able to cover its CAPEX and cash acquisitions with the cash flow from operation. Most of the excess was then returned to shareholders via dividends and buybacks.
Table 2: Sources and Uses of Funds 2017 to 2024. (Author)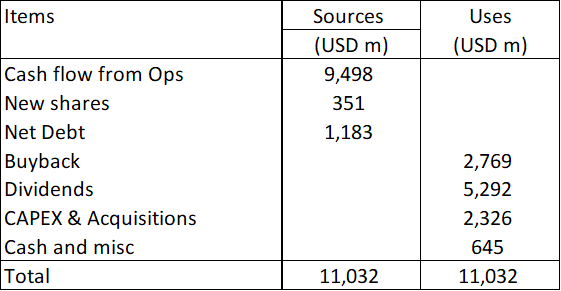
I would even consider Amcor a cash cow. The only negative point I have is its debt-capital ratio of 63% as of the end of Mar 2024. While it had come down from its 2018 high of 85%, it was still higher than the 38% ratio for the US packaging sector. (Source: Damodaran Jan 2024 dataset).
However, looking at Table 2, the debt could be easily reduced by reducing the buybacks and dividends. As such I would not be too concerned about the debt level.
Valuation
There are 2 key parameters in the valuation of Amcor – growth and Reinvestment rate.
The 2019 Bermis acquisition was the largest one over the past decade. Before this, the largest was the USD 2.5 billion acquisition of Alcan Packaging and Ball Plastics Packaging in 2010. Both these acquisitions provided a jump in revenue.
- The 2011 grew by 26% while the 2020 revenue grew by 32% compared to the respective preceding year’s revenue.
- Revenue growth in the subsequent years was either negative or 3% respectively.
The point is that without the major acquisitions, revenue growth was modest. I do not have a crystal ball to see when Amcor will undertake another major acquisition.
As such, in valuing Amcor I will assume that there will not be another major acquisition. Rather I will model it based on a modest perpetual growth rate of 4% per annum.
Secondly, I have shown that historically Amcor had a negative Reinvestment rate. In my valuation, I will consider 2 Scenarios:
- Scenario 1. Zero Reinvestment rate.
- Scenario 2. Reinvestment rate based on the fundamental growth equation of Growth = Return X Reinvestment rate.
I estimated the intrinsic value of Amcor to be USD 19 per share under Scenario 1 and USD 9 per share under Scenario 2. The market price of Amcor was USD 10 per share as of 7 May 2024.
There is more than a 30% margin of safety under Scenario 2. If you have a long-term investment horizon (to match the long-term Reinvestment rate of zero), Amcor is an investment opportunity.
Valuation model
I valued Amcor based on a single-stage Free Cash Flow to the Firm (FCFF) model where the EBIT was determined based on the business set-up as shown in the left part of Chart 2.
EBIT = Contribution – Fixed Cost.
Contribution = Revenue X Contribution margin.
FCFF = EBIT(1 – t) X (1 – Reinvestment rate) X (1 + g) / (WACC – g).
g = GDP growth rate of 4%.
Value of equity = Value of firm + cash + Other investments – Debt – Minority interests.
Table 3 illustrates the calculation for Scenario 1.
Note that in my valuation model, I have not considered the improvements in the operating and capital efficiencies. These were represented by the contribution margin and capital turnover in the model. Rather I used the 2020 to 2024 average values.
Table 3: Estimating the intrinsic value (Author)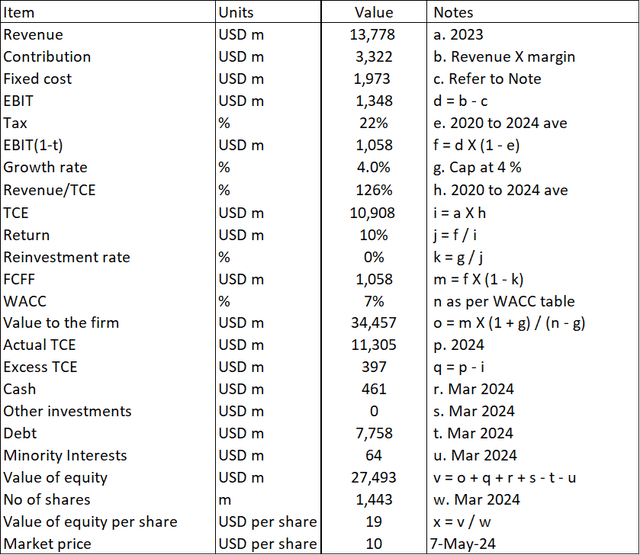
Notes to Table 3:
Item b = contribution margin based on the 2020 to 2024 average.
Item c = Fixed cost + past 5 years other costs for restructuring and write-downs.
Risks and limitations
You should consider the following when looking at my valuation.
- No major acquisition.
- Reinvestment rate.
- Share buyback.
Over the past 20 years, there have been 3 major acquisitions. Apart from the 2010 and 2019 ones mentioned earlier, the data showed that in 2003, the company incurred USD 2.9 billion for cash acquisitions. As such, you should not rule out another major acquisition in the next decade.
Now, whether another acquisition would be value accretive would depend on the acquisition price as well as how the company extracts the synergies. Given its track record, I am more inclined to believe that it would boost its intrinsic value. As such, my current valuation is a conservative one.
For Scenario 1, I assumed a zero Reinvestment rate based on the past 8 years’ performance. This may just be an anomaly and to check for this, I computed the Reinvestment rate from 2002 to 2024 but excluding the 2003 and 2010 cash acquisition years. The Reinvestment rate was 9%. When I used this rate in my valuation model, the intrinsic value came to USD 17 per share. There is still more than a 30% margin of safety.
You may think that a Reinvestment rate based on the growth equation under Scenario 2 is more realistic. Under this Scenario 2, the Reinvestment rate was 41%. However this was based on the average past 5 years returns. It ignored the 4.9% compounded annual improvement in the operating return since 2019. If we assumed a 20% improvement in the historical average operating return, we will still have a 30% margin of safety.
Given the above, I would consider Scenario 2 the worst-case one. In other words, at worst you would not make money.
In my valuation, I have assumed that there is no further share buyback. The reality is that the company had been actively buying back its shares over the past 5 years. I have shown that it had the cash generation ability to do so.
In other words, the growth in EPS was due to a combination of earnings growth and buyback.
- If I assumed that there was no share buyback, the EPS would increase from USD 0.39 per share in 2020 to USD 0.41 per share in 2024. This EPS growth was due just to profit growth.
- However, the actual EPS in 2024 was USD 0.45 per share because of the share buybacks.
- The share buyback boosted the EPS by about 10%.
Many investors look at growth in EPS. As such, I would treat the buyback as another margin of safety that is not covered by my valuation.
Conclusion
Amcor is a fundamentally sound company. There were growths in revenue, operating profit, and returns over the past 6 years. The company is also financially sound. However, I have some concerns about the improvements in the operating and capital efficiencies.
As such, in valuing the company, I have not built in the improvements in the operating or capital efficiencies. At the same time, despite its history of large acquisitions every 7 to 8 years, I have ignored this in my valuation.
On such a basis, I found that there is more than a 30% margin of safety at the current market price. Together with its good fundamentals, I would consider this an investment opportunity.
Credit: Source link


