
FinkAvenue
In my last article about Amazon.com, Inc. (NASDAQ:AMZN) – published about half a year ago in June 2023 – I rated the stock as a “Hold” and was rather cautious about the stock being a good investment at this point. In the meantime, Amazon increased 21% and clearly outperformed the S&P 500 (SPY), which increased only about 8% in the meantime.
Although I didn’t see Amazon as a good investment, I wrote in my last article:
When looking at the chart, it seems like Amazon broke its downtrend already and could be on its way towards higher stock prices again.
And while I saw the potential for a short-term uptrend, I also wrote:
However, I don’t see Amazon in an uptrend yet – at least not before it can break above $145. And in my opinion, there is still huge downside risk, and the current upward wave seems like a bull trap as it is only a correction of the previous down wave. I would still hold out for Amazon either reaching the range between $65 and $72 or – in a more extreme case – the support level around $45. I know these price targets might seem absurd to many Amazon bulls, but the combination of growth slowing down due to a potentially severe recession and a stock price built on high growth expectations could easily lead us there.
And as Amazon is trading for $145 now let’s look at the business and stock again and we start by looking at the chart.
Technical Picture
As already mentioned above, Amazon seems to be at a resistance level right now which might determine if Amazon can continue its upward trend or if we see a reversal and lower stock prices again. In my last article, I mentioned that Amazon broke the decline trendline (white line) in early May and higher stock prices followed. But I also mentioned that we see a rather strong support level around $145 and as we can see above, Amazon already bounced off that support level.
Amazon Weekly Chart (TradingView)
This resistance level (which is rather a resistance area between $140 and $148) consists of several lows Amazon generated in the years 2020 to 2022 as well as the 78.6% Fibonacci level that is tested again.
And in my opinion, the scenario for the following months is lower stock prices again – as I have already written in my last article. In my opinion, this wave from about $80 to $150 was only the correction of the previous bearish wave and in the following quarters, we will see another bearish wave that will lead Amazon at least to $80 (and possibly lower). What we are seeing right now is – in my opinion – a bull trap.
Valuation
And when arguing for a stock price of $80 or lower as a possibility I can already hear the shouting and people claiming this is an absurd price. I can offer you a different perspective to look at things. Analysts are expecting earnings per share of $2.67 for fiscal 2023 and if the stock trades at $80 this will result in a P/E ratio of 30. Of course, this is an unusually low P/E ratio for Amazon, but not a P/E ratio screaming “bargain”.
And when going several quarters back, Meta Platforms (META) was suddenly trading for $90 and a single-digit valuation multiple. In the last few years, we can also name PayPal Holdings (PYPL) as an example of a stock everybody was extremely bullish about only to see an 80% decline (and PayPal has not recovered so far). Why should Amazon be immune to such a scenario? We just need the same ingredients as for PayPal or Meta Platforms – the business struggling a little bit and investors losing confidence.

So far, investors are rewarding Amazon with extremely high valuation multiples – as they see a great business model with a wide economic moat and extremely high growth rates. And while they are not completely wrong, the valuation multiples might still not be justified. Of course, Amazon still grew revenue with a CAGR of 23.64% in the last five years and operating income with a CAGR of 24.43% in the same timeframe.
Quarterly Results
And we already saw revenue growth fall off a cliff in the last few quarters. And in the past, there have been quarters with similar low growth rates, however Amazon has always recovered quickly. Now we are seeing about eight quarters in a row with growth rates “only” around 10%.

When looking at the last quarter, Amazon certainly reported solid results (one might even call them good). Total net sales increased from $127,101 million in Q3/22 to $143,083 million in Q3/23 – resulting in 12.6% year-over-year growth (the highest growth rate in the last four quarters). Net product sales increased 6.5% YoY to $63,171 million and net service sales increased 17.9% YoY to $79,912 million. And while Amazon could report solid revenue growth, operating income more than quadrupled from $2,525 million in the same quarter last year to $11,188 million this quarter and is reporting a record quarterly operating income (of course, a growing business will report record numbers on a regular basis). Diluted earnings per share increased 236% from $0.28 in Q3/22 to $0.94 in Q3/23.
Amazon Q3/23 Earnings Release
And Amazon could report a free cash flow of $21.4 billion in the last four quarters – compared to a negative free cash flow of $19.7 for the trailing twelve-month period ending one year earlier.
Segment Results
When looking at the three major segments of Amazon, all contributed to revenue growth. Let’s start with the North America segment, which reported $87,887 million in sales (11.5% YoY growth) and operating income jumping from $412 million in the same quarter last year to $4,307 this quarter.
Amazon Q3/23 Investor Presentation
The International Segment could report $32,137 million in sales (15.9% YoY growth) and while the segment still had to report an operating loss of $95 million this is a huge improvement to an operating loss of $2,466 million in the same quarter last year.
Amazon Q3/23 Investor Presentation
And AWS could increase sales 12.3% year-over-year to $23,059 million and operating income increased from $5,403 million in the same quarter last year to $6,965 million this quarter (resulting in 28.9% YoY growth).
Amazon Q3/23 Investor Presentation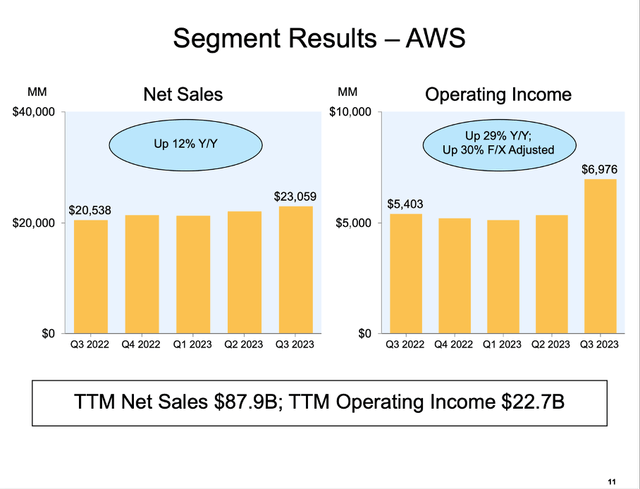
Many Positive Signs
When looking at the results and metrics Amazon is reporting so far, there are many positive signs and a lot of reasons to be optimistic. For starters, we can look at the advertising services, which generated $12,060 million in sales and could grow 26% in reported numbers (25% when adjusting for FX). Amazon is also pushing Prime Video towards more advertising and management is pleased with the progress so far. During the last earnings call, CEO Andrew Jassy commented:
Prime Video continues to be an integral part of the Prime value proposition where it’s often one of the top 2 drivers of customers signing up for Prime. We also have increasing conviction that Prime Video can be a large and profitable business in its own right as we continue to invest in compelling exclusive content for prime members but also offer the best selection of premium streaming video content anywhere with our marketplace offering, including channels for customers who can subscribe to channels like Max, Paramount+, BET Plus and MGM+, as well as our broad transaction video-on-demand selection.
And beginning in early 2024, Prime Video shows and movies will include limited advertisements with customers being able to pay an additional $2.99 per month for these ads to disappear. It is also worth pointing out that Amazon is growing its advertising sales at a much higher pace than competitors Meta Platforms and Alphabet (GOOG), which is a good sign for Alphabet and indicates it is gaining market shares.
Aside from growing advertising sales at a high pace, Amazon also increased sales from third-party seller services 18% year-over-year to $34,342 million due to a growing adoption of the optional services Amazon is offering for sellers.
Additionally, Amazon is also moving ahead with its “Project Kuiper” which could become another success and cash cow for the business – similar to AWS. During the last earnings call, management commented:
And our low Earth orbit satellite initiative Project Kuiper which aims to bring fast, affordable broadband to underserved communities around the world, took a meaningful step forward in the last few weeks with the successful launch of 2 prototype satellites. We will use this multi-month mission to test our satellites and network from space and collect data ahead of the planned start of satellite production later this year.
Finally, management talked a lot about the new fulfillment system in the United States during the last earnings call. Instead of a single national fulfillment network in the U.S., Amazon moved to 8 distinct regions. With higher local in-stock levels and optimized connections between fulfillment centers, Amazon hopes for shorter travel distances and fewer touches resulting in lower costs as well as customers getting their shipments faster. During the last earnings call, CFO Brian Olsavsky stated:
The third quarter marked the second full quarter of regionalization within the U.S. and we’re pleased with the early results. Regionalization has allowed us to simplify the network by reducing the number of line-haul lanes, increasing volume within existing line-haul lanes and adding more direct fulfillment center to delivery station connections. We have also been focused on optimizing inventory placement in a new regionalized network which when coupled with the simplification mentioned earlier, is helping contribute to an overall reduction in cost to serve.
Problems Ahead
When listening to management, looking at the presentations, and studying the metrics Amazon is reporting, the picture seems to be quite positive. Nevertheless, I would not see the overall picture so positive – instead I see dark clouds on the horizon and problems ahead. I have mentioned these problems now in several different articles – including my previous articles about Starbucks Corporation (SBUX) and Simon Property Group (SPG). And Amazon could face similar problems as Amazon is still a business heavily dependent on retail sales and consumer spending in a healthy economy.
For starters, bankruptcies in the United States are increasing and in the months of January to October, the number of bankruptcies is almost the same as in 2020 during a recession, aside from 2020 the reported number of bankruptcies is the highest since 2010.
S&P Global
Aside from bankruptcies, the rising credit card delinquency rates are also indicating trouble. And while a delinquency rate of 2.98% is still much lower than the rates we saw during the Great Recessions and the previous two decades, the constantly increasing rate is not a good sign.
FRED
Fitch for example is expecting retail volumes to decline in the low single digits in 2024. And PYMNTS Intelligence published a small study about the expected consumer spending during the holidays and the numbers are not looking good. Of course, the survey was conducted at the end of September 2023 and the amounts spent in the end might be different, but the study is expecting non-gift holiday spending to be only $859 (compared to $1,162 the previous year). Gift spending on the other hand is expected to increase slightly (about 2% year-over-year).
PYMNTS Intelligence
This is also not a good sign, but Amazon will not be affected as much by non-gift spending as the items purchased on Amazon will mostly be gifts (at least during the holiday season).
And data from Adobe Analytics is showing record holiday season spending with money spent on Cyber Monday growing 9.6% year-over-year to $12.4 billion and money spent during Cyber Week growing 7.8% YoY to $38 billion.
However, Amazon was still rather optimistic during its earnings call and management reported that it had its biggest Prime Day ever – a good sign that consumers are continuing to spend:
During the quarter, we held our biggest Prime Day event ever with prime members purchasing more than 375 million items worldwide and saving more than $2.5 billion on millions of deals across the Amazon store. Outside of Prime Day, we continue to see strong demand across everyday essentials, including categories like beauty and health and personal care.
And management also seems to be optimistic for the upcoming holiday season:
And on the stores side, we’ve already kicked off what will be our 29th holiday shopping season. Prime Big Deal Days held earlier this month was our most successful October holiday kick-off event ever, with Prime members saving more than $1 billion across hundreds and millions of items sold. Just as we do all year long, we aim to make our customers’ lives easier and better every day and there’s no time where it’s more important to us that we deliver on this mission than during the busy holiday shopping season.
Intrinsic Value Calculation
I already mentioned above that investors are still rewarding Amazon with high valuation multiples – despite growth rates slowing down in the last few quarters. And not only valuation multiples are indicating that Amazon is not a bargain, but when calculating an intrinsic value by using a discount cash flow calculation we come to the same conclusion.

As basis for our calculation, we could use the free cash flow of the last four quarters (which was $16.92 billion) but let’s be a little more optimistic and assume Amazon can reach its peak free cash flow of $26.96 billion next year again. When calculating with a 10% discount rate and 10,558 million outstanding shares, Amazon must grow its free cash flow almost 18% for the next ten years followed by 6% growth till perpetuity. And while we can discuss if Amazon might be able to grow at a higher pace than 6% in ten years from now, I refuse to calculate with higher growth rates as we never know what the future might bring and there is no reason to be groundless optimistic.
Amazon Consensus EPS Estimates (Seeking Alpha)
Growing about 18% during the next ten years seems to be achievable for Amazon and is almost in line with analysts’ expectations: Between fiscal 2023 and fiscal 2032, analysts are expecting earnings per share to grow with a CAGR of 17.44% and therefore Amazon could be seen as fairly valued from this point of view. But we should not ignore that a potential recession might have a negative impact on the business and growth rates.
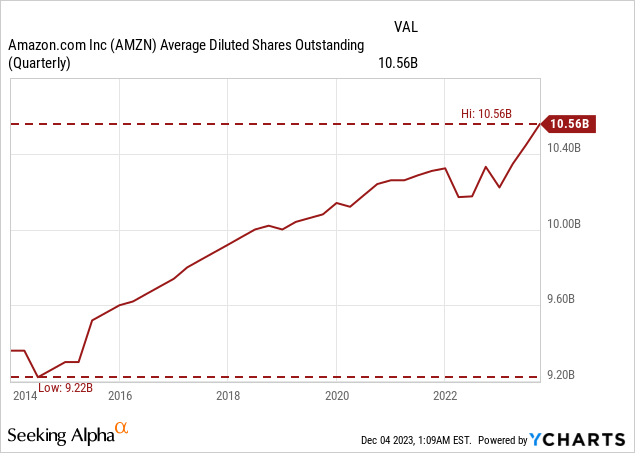
We should also not ignore that Amazon is constantly increasing the number of outstanding shares (in the last twelve months from 10,331 million to 10,558 million) and there might also come a time when this retail giant is not able to grow with almost 20% annually anymore.
Conclusion
Amazon is still reporting solid results and is expecting a good holiday season. But due to rising credit card delinquency rates, rising number of bankruptcies and several other early warning signs indicating a recession, I would be cautious. Amazon is without much doubt a business that will be affected by a recession – retail sales (including third-party seller services) and advertising sales will certainly take a hit. And to be fairly valued at this point, Amazon still has to grow its free cash flow 18% annually (and this is assuming a high free cash flow for 2024 and additionally it has to stop the dilution of shares outstanding).
Credit: Source link