

JHVEPhoto/iStock Editorial via Getty Images
Shares of Ally Financial (NYSE:ALLY) jumped 7% on Thursday after reporting strong quarter. This rally added to substantial gains of 43% over the past year for ALLY as credit losses have not been as bad as some feared. Shares have also rallied 44% since I rated them a buy last September, more than tripling the return of the S&P 500. In the process, they have surpassed my low $30’s price target. Given this, now is a natural time to re-evaluate Ally. I continue to be bullish.
Seeking Alpha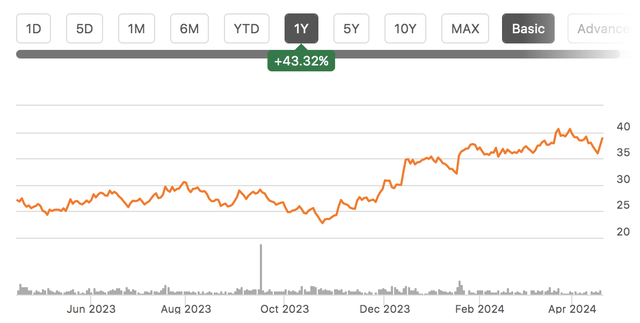
In the company’s first quarter, Ally earned $0.45 in adjusted EPS, beating consensus by $0.12. Earnings were down from $0.82 last year as higher funding costs and increased credit losses have reduced the company’s profitability. However, I am increasingly confident we have seen results bottom and will now be seeing sequentially growing earnings. Moreover, Ally’s performance over the past year—staying profitable and growing deposits—has validated the company’s viability and ability to withstand downturns.
Turning first to interest rate performance, Ally saw net financing revenue decline to $1.47 billion from $1.61 billion last year. This decline was due to the fact that net interest margin (NIM) was 3.16%, down 4bps sequentially and 38bp from last year. While asset yields rose by 56bps from last year to 7.27%, deposits rose by 105bps to 4.28%. Over the past year, deposit costs have risen across the industry as banks have passed on more of the Fed rate hikes amid a fight for funding in the wake of Silicon Valley Bank’s failure.
Ally has acquitted itself strongly during the period of stress. Ally’s deposits rose to $155.1 billion in Q1. About 94% of these are retail deposits, and as you can see below, Ally has been able to grow deposits over the past year even as many small and medium-sized banks saw outflows.
Ally Financial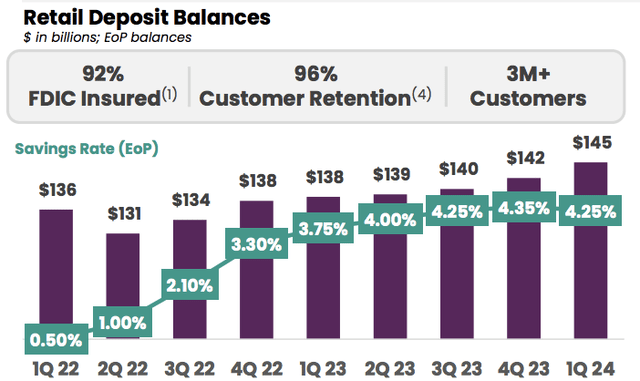
Ally’s deposit base has held in better in my view because of its retail focus with the vast majority of funds being FDIC insured. Moreover, Ally does not have material noninterest-bearing balances like more traditional banks, and it is those deposits that have shown the most flight risk. Ally also is paying among the highest interest rates in the industry, which has made it an attractive place to deposit money.
Importantly, we are seeing deposit price pressures begin to ease. Deposit yields rose just 9bp sequentially, and this may prove to be the final sequential increase. During Q1, Ally reduced its 12 month CD rate by 75bps (impacting $10 billion of deposits) and its savings rate by 10bps (impacting $84 billion of deposits). Deposit yields still rose on average as CDs issued in early 2023 and 2022, which had low yields, matured, creating an unfavorable mix shift. With most low-cost deposits now having rolled off, these price cuts should have more of an impact.
Importantly, Ally continued to grow deposits in Q1 even as it reduced rates as its new rates are still highly competitive relative to peers. This suggests it may have room to bring down deposit costs further. In fact, it reduced savings rates another 5bps Thursday morning, after waiting to see tax season flows, which were better than expected. Management expects to see NIM expansion in Q2, as a result.
Even with the Fed unlikely to start cutting rates soon, Ally is passing the peak of its own funding costs. Meanwhile, Ally had a net $9.8 billion of originations with a retail auto yield of 10.92%. With this yield 300bps above its total asset yield, we should see portfolio yields increase, further supporting NIM expansion. Importantly, Ally’s underwriting also appears disciplined; the 29% approval rate was down from 31% last year, indicative of slightly tighter standards.
With NIM moving from a headwind to a tailwind, the other major item is credit quality. Ally took $507 million in provisions for credit losses. This was down from $587 million last quarter but up from $446 million last year. The primary driver of provisions is charge-off activity. Indeed, Ally had $539 million of charge-offs and $32 million of reserve releases. Ally carries $3.6 billion in reserves, about 3x delinquencies. This above my 2.5x benchmark for strong reserve coverage, and as such, I expect modest reserve releases to continue. Indeed, Ally believes its reserve are 0.3% above “normal” levels. Its macro scenario assumes 4.1% unemployment this year and a 2-year migration to 6%, which is fairly conservative in my view.
As you can see below, auto delinquencies improved quarter over quarter. This is a standard seasonal trend as consumers can use tax refund payments to catch up on delinquent debt payments. While delinquencies are higher than a year ago, there have now been five straight quarters of deceleration in YoY delinquency growth.
Ally Financial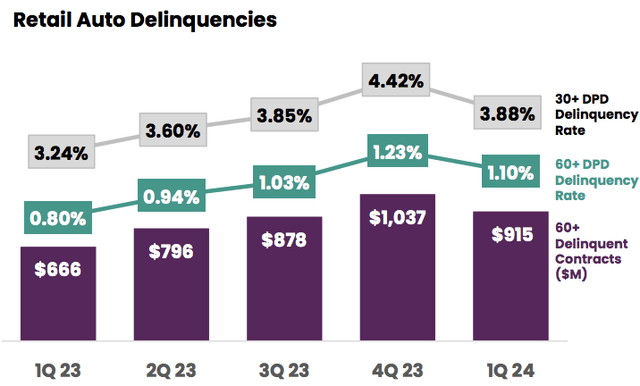
Accordingly, management expects to see auto losses decline throughout the year. This is partly driven by the fact we are moving from the 2022 vintage to the 2023 vintage being the primary driver of losses. 2022 losses have been more severe than prior years as they were made at a time when used car prices were exceptionally high, and falling prices creates the risk of lower recoveries on delinquencies. While used car prices are still falling, the pace is moderating, creating less residual price risk for Ally on more recent vintages.
St. Louis Federal Reserve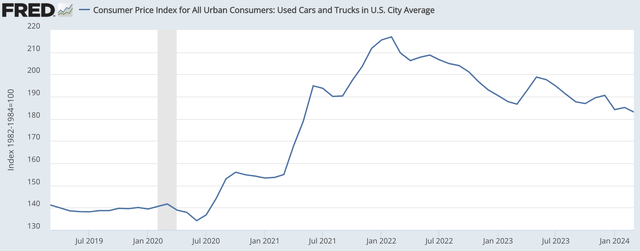
With credit costs also likely peaking and NIM almost certainly having bottomed, Ally is well positioned to grow earnings sequentially, which its guidance implies. Its 2% auto charge-off rate for the year is below Q1’s 2.27%, and NIM could expand by 3% on average. Moreover, Ally is well capitalized; its tier 1 common equity (CET1) ratio was flat sequentially at 9.4%, slightly above its 9% target.
Ally Financial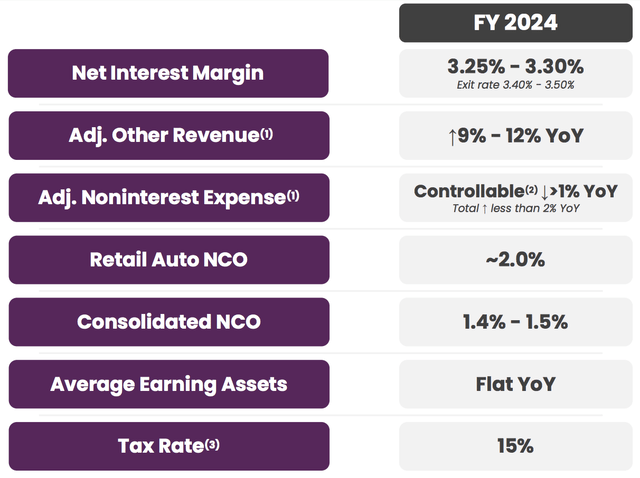
As such, I expect Ally to earn $3.20-$3.50 in calendar 2024. However, as higher cost deposits continue to mature, we are likely to see earnings accelerate through the year. I would look for Ally to get to $0.95-$1.05 in quarterly earnings by year-end, implying an annual earnings pace of $4.00 as it exits 2024.
Ally is essentially trading 11-12x 2024 earnings, but with annual earnings on their way to $4 as this acceleration takes hold, shares are likely just about 9x 2025 earnings, and where shares are trading at the end of 2024 is more driven by what investors expect 2025 to be like than how 2024 was. Ally’s deposit performance has been impressive, and its credit underwriting proved durable. I believe the momentum can continue and shares will get to $42-45 as earnings continue to rise or about 10-11x run-rate 2025 earnings, as Ally continues to close the valuation gap with other regional banks. That provides 10-15% upside alongside a 3.3% dividend yield. As such, I remain a buyer of Ally, even after these large gains.
Credit: Source link