
Indigo Division
For those looking to profit from the coming rise in domestic natural gas prices, buying thermal coal producers at today’s bargain valuations offers asymmetric upside.
Alliance Resource Partners (NASDAQ:ARLP) offers significantly undervalued and high-yielding exposure to thermal coal tailwinds with meaningful growth potential through its attractive royalty business.
The Case for Thermal Coal
Since the Newcastle Thermal Coal Index peaked at $428/ton in September 2022, coal futures have sold off and traded around $140/ton in recent months. This is well above pre-COVID levels when the index traded range-bound between $60 to $100/ton. Many coal miners, including ARLP, operate at a healthy profit margin at today’s prices, which are underpinned by a number of significant tailwinds.
Global Coal Demand is Still Growing
Contrary to investor sentiment, coal demand has been resilient. In its 2018 report, the EIA ‘called the top’ of coal demand, saying we would not “regain the peak of 2014 [of coal demand],” yet in its 2023 outlook, the EIA projects that global coal consumption will plateau until at least 2026. This projection follows an all-time high coal demand in 2023, where consumption grew 1.6% to 8.5 billion tons last year.
Global Coal Demand (EIA)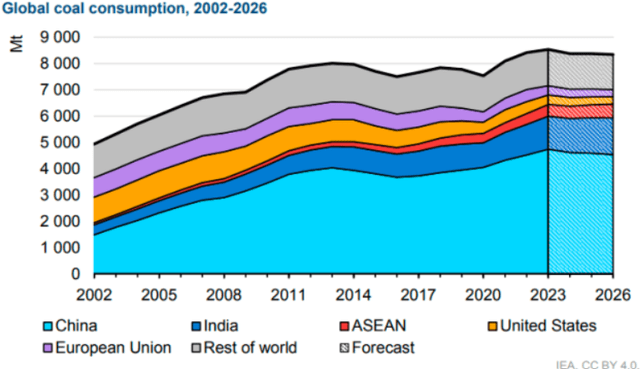
The rise in consumption is partly owing to the reliability of coal as a baseload energy source. In response to a full sanction on Russian coal imports, the EU secured American coal to support electricity generation through a mild winter, allowing the EU to build natural gas stocks.
Last October, Germany re-activated coal-fired power plants to ensure energy security through the winter with some German coal producers ‘optimistic’ they will continue producing coal into the 2030s, past the government’s ‘phase out’ target date. Without coal in the energy mix, Europeans risk high price volatility and prolonged, elevated prices. Although Europe now has more natural gas stocks than last winter, risks to energy inflation come at a precarious time in the rate cycle.
Newcastle and Rotterdam coal futures continue to trade backwardated, a bullish demand indicator that end users are paying a premium to secure coal in the spot market today.
US Coal Exports (EIA)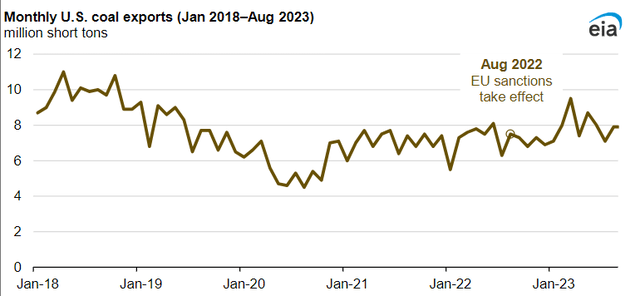
Meanwhile, cheap Russian thermal coal has been diverted to Asia, effectively subsidizing their investments in new coal-fired power plants. In 2022, China approved the record construction of 106 GW of new coal power capacity (equating to 2 new power plants a week) and, based on permits pulled, is on pace to surpass that record in 2023.
India also announced plans to add 17 GW of new coal power capacity in the next 16 months to avoid outages, as electricity demand grows. That is more than triple the 5 GW average annual capacity they have added in the past 5 years. Last month, the Indian government solicited private investments in coal-fired power plants, calling it a “growth opportunity.”
Indonesia, itself a major exporter of coal, also ramped up its use of coal for energy and metallurgical (primarily nickel production) uses in 2022. Out of the 35 GW to be added in new power capacity in 2024, 20 GW (~57%) will be coal powered.
Indonesian Ministry of Energy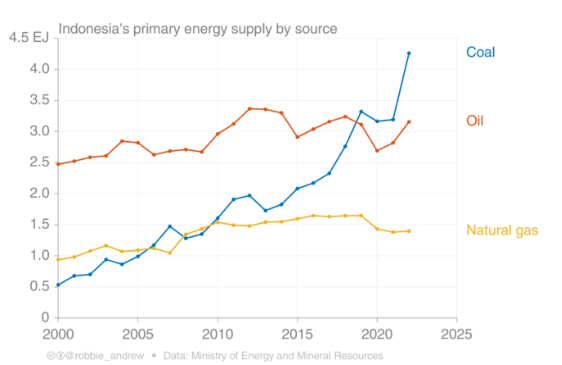
Even with elevated prices, the ability to store and transport a widely accessible and affordable baseload power source makes coal the logical choice for emerging economies that do not have the luxury to scale ‘green energy’ infrastructure.
North American Gas Exports Are Set to Rise
Most natural gas E&Ps at today’s Henry Hub strip are fully valued, and those running unhedged books are breaking even (or losing money) with spot natural gas near 2020 lows of $1.60MMBtu. Exposure to the thermal coal market offers the upside of natural gas at a significantly cheaper valuation.
As a substitute product, coal pricing remains highly dependent on natural gas markets. Driven by the growth in North American shale output and significant development capex in the past 10 years, spot US natural gas prices have not traded much above $3/MMBtu, aside from the post-COVID spike in 2022.
Natural Gas Demand (GECF)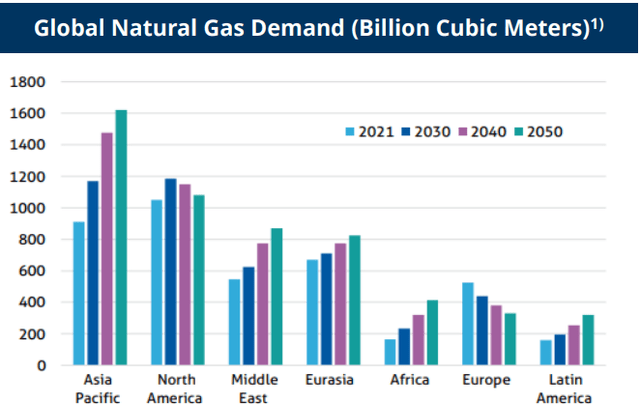
To meet Asian and Middle Eastern demand, LNG export capacity from North America is forecasted to more than double to 24.3 bcf/d from 11.4 bcf/d by 2027. Unsurprisingly, gas flows to US liquefaction plans are at record levels with 100%+ utilization rates. As more US gas flows overseas to higher priced international markets, domestic natural gas prices will rise and hamper coal-to-gas switching in the coming years.
Recently, the Biden administration paused pending and future permits to construct export LNG facilities until the DoE completes a review of climate impacts. This decision will not impact terminals currently under construction (pictured below) nor those that have been permitted but not yet under construction, so this ruling only has a limited impact on midstream companies for now.
LNG Export Capacity (EIA)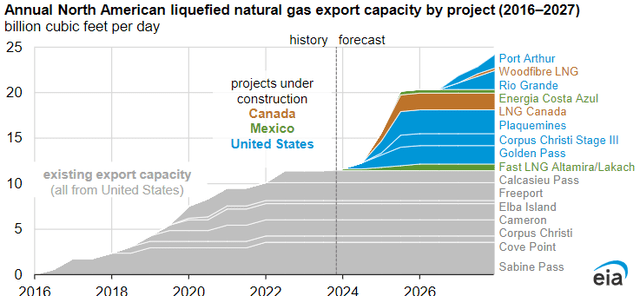
While there have been gains in oil & gas extraction efficiencies, there has been a significant capital underinvestment in upstream energy projects with a 28% increase in annual capital spending needed by 2030 to ensure adequate supply, according to the EIF. Capital spending by the top oil & gas companies still remains well below pre-COVID levels with energy companies focused primarily on shareholder returns and de-leveraging. Higher cost inflation associated with extraction (labor, equipment, services, etc.) and a less favorable financing environment may also hinder new projects and support higher prices.
O&G Capex Spend (EIA)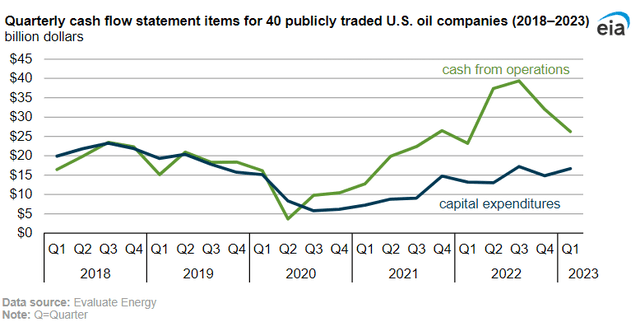
Meanwhile, US underground storage capacity for natural gas has not grown at all in the past 10 years. As exports increase, insufficient storage capacity may leave the US susceptible to price volatility, as evidenced in the leadup to last winter. This may incentivize utilities companies to secure longer-term contracts for coal and gas, a trend that ARLP management recently noted on its earnings call, claiming “[we] are participating in solicitations for tonnage in the 2025 to 2028 period.”
Underground Storage Capacity (EIA)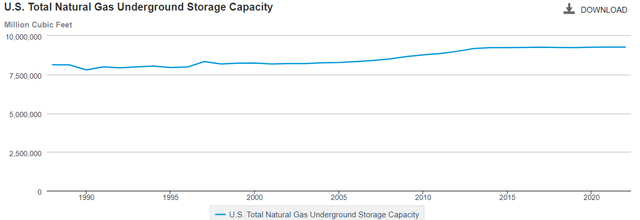
Despite higher than average coal inventory this winter at power plants, pricing has remained strong and, as the natural gas market tightens, coal producers (now fewer in size/scale) may be price makers.
US Electricity Demand Surging
While coal’s share of US electricity generation may stagnate and decline in the coming years, the overall pie of domestic electricity demand will grow rapidly. The surge in construction of data centers, electric vehicles and re-shoring are putting new strain on an already aging US power grid.
US Electricity Demand (ARLP Earnings Presentation)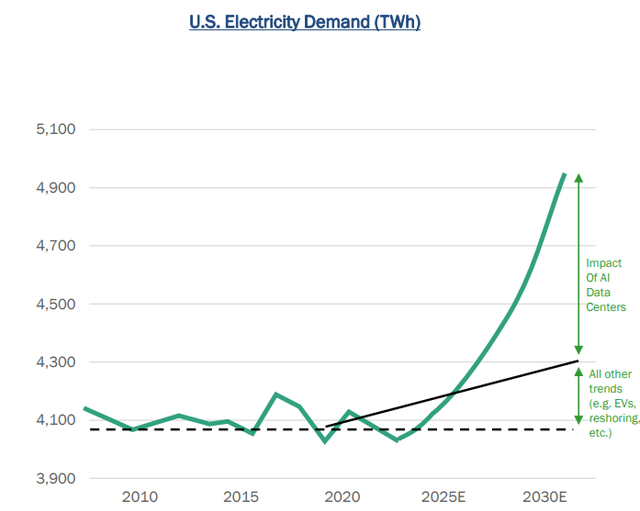
The amount of incremental new electricity demand in the US doubled in 2023 to 564K GWh, compared to 2022. This load growth has led many utilities to increase their near-term electricity demand forecasts beyond what the US grid is ready for. The implications could result in “utilities adding more fossil fuel generation or delaying retirement plans,” according to some experts.
Incremental Electricity Demand (Washington Post)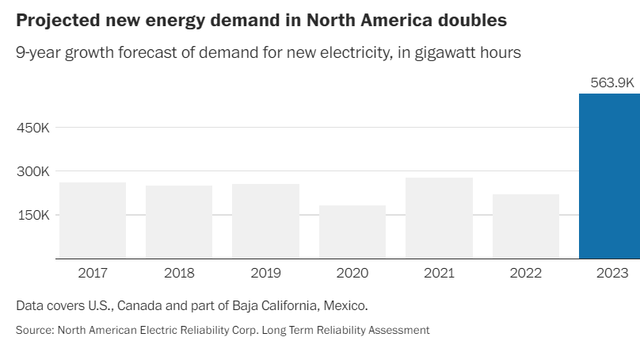
ARLP claims that it is already seeing some customers push back coal-fired power plant retirements, suggesting there is more runway in the domestic thermal coal business than the market is pricing in.
ARLP Earnings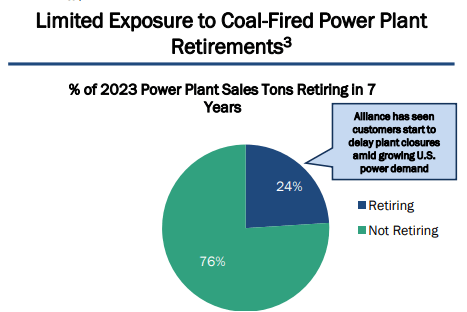
Keep in mind that current thermal coal pricing has remained steady, despite some of the lowest natural gas prices post the US Shale Revolution. Assuming spot natural gas prices eventually catch up to futures strip pricing ($4/MMBtu in Dec ’25), we may see delays in coal-to-gas switching, an increase in natural gas price volatility and customers paying up to secure stable long-term coal supply. Given ARLP’s valuation and margins on current coal pricing (to be discussed), the company’s coal business trades as a free option on this volatility.
Alliance: Positioned for Commodity Upside
While there are a number of other attractively valued thermal coal producers, ARLP offers unique tax-advantaged exposure to Tier 1 assets, a long reserve life, and exposure to mineral royalty streams.
Long Reserve Life and Access to Export Markets
Alliance Resource operates 7 underground mines across the Illinois and Appalachian basins and is the fifth-largest coal producer, by tonnage, in the country. The company is expected to produce and sell 35 million tons of thermal coal in 2024, predominantly to domestic utility companies, such as Duke Energy, Louisville Gas and Tennessee Valley Authority. Appalachian and Illinois Basin coal trade at a premium in prices to coal prices at the competing Uinta and Powder River Basins due to the higher heat content, which is more desirable for thermal uses.
Its mines have 581 million tons of proven and probable reserves and 1.2 billion tons of measured, indicated and inferred coal resources. This is about 15 years of producible reserves with an additional 16 years of reserve growth potential, assuming current production levels. ARLP is also advantaged by its wholly owned coal loading terminal next to its River View mining complex along the Ohio River. By transporting coal by barge rather than expensive rail or truck, the company achieves much better price realization, often above Illinois Basin spot prices.
Coal Mining Operations (ARLP Presentation)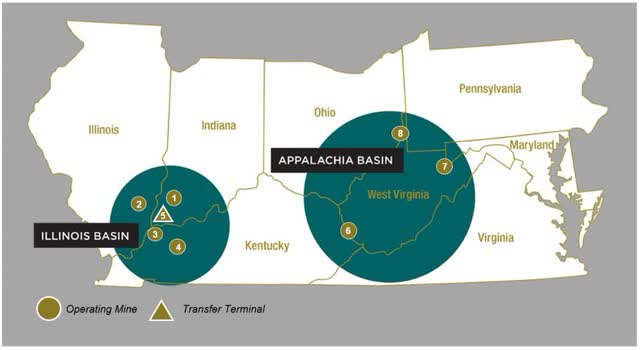
This proximity to the Ohio River also gives ARLP direct access to the Gulf international export market, which is a meaningful advantage if ‘days of burn’ inventory at utilities continue to stay high in the short term. In 2023, the company exported ~15% of its coal production to foreign markets. According to management, so far 4.5 million tons (14%) have been committed to export in 2024 with the company able to opportunistically sell uncommitted tons into those markets when pricing is attractive.
O&G Royalty Stream
In addition to its core thermal coal business, ARLP operates a meaningful oil & gas royalty stream, owning 68,000 net royalty acres in the Permian and Anadarko basins with 9 years of proven reserves. This complements ARLP’s 20 million ton/year coal royalty stream, leased substantially to Alliances’ own mining complexes.
ARLP’s Royalty Business (ARLP Q1 Earnings)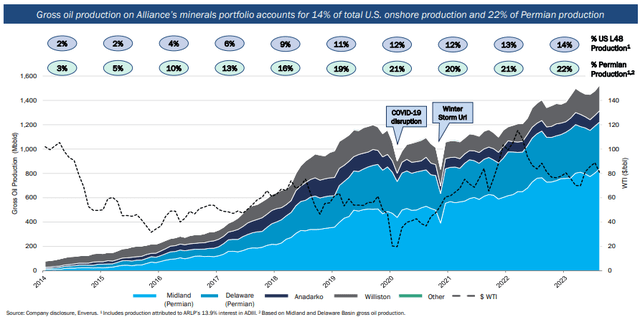
In exchange for allowing the production and development of wells on its land, ARLP receives an upfront “lease bonus”, followed by a multiyear stream of cash flows based on a fixed percentage of production revenue. This is a highly attractive business, given all drilling costs, capital expenditures and plugging costs are borne by the lessee. Compared to the capital intensive nature of coal mining, the royalty business operates at an 85%+ EBITDA margin.
In revenues, the coal royalty stream generates ~$65 million a year (3% share) and the oil & gas royalty stream generates ~$130 million a year (6% share); however, both combine for ~$160 million in EBITDA (16% share). Net of capital expenditures, these segments generate over a quarter of company free cash flow. Management has scaled this business significantly since 2019. Last quarter, ARLP achieved record oil & gas royalty volumes, an 18% YoY increase. At an annualized 3.6M boe/year, this is over double the 1.6M boe in royalty production in 2021.
ARLP Corporate Presentation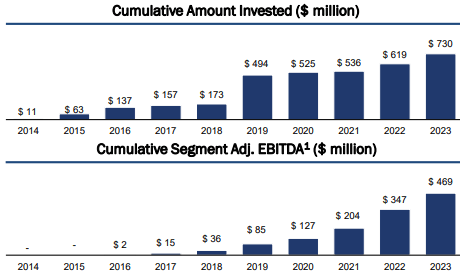
In Q1, the company closed on its acquisition of 2.4K oil & gas net royalty acres in the Anadarko, Williston and Delaware Basins for $14.5M and separately added another 864 net royalty acres in the Permian. Management has made it clear that they plan to “allocate capital to grow this business further in 2024.”In particular, they plan to place a greater focus on the liquids side of oil and gas. This growing portfolio of royalty acreage offers meaningful growth potential, as most of the carrying value lies in mineral interests in ‘unproven’ properties.
With remaining Tier 1 oil and gas acreage quickly growing scarce in the Permian, major E&Ps have been forced to acquire smaller ones at growing premiums or compete for leased acreage. This may drive multiple expansion in the O&G royalty business.
EV/EBITDA Multiple Comp Set (Koyfin)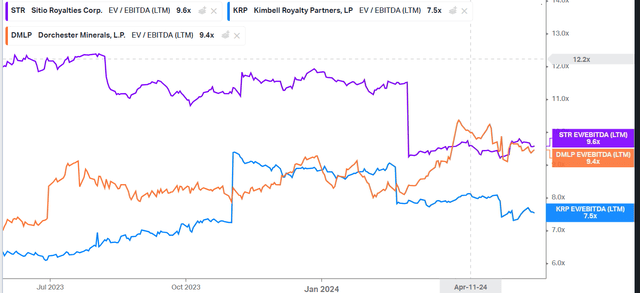
With comparable royalty companies trading at a conservative 8x EV/EBITDA, Alliance’s royalty business alone is likely worth close to $1.3B today. This does not include significant upside potential based on inorganic production growth on recent acquisitions, multiple expansion and the rise in energy prices.
The rotation of capital from a high capex coal mining business to a high margin royalty business will unlock meaningful multiple expansion in the coming years.
Tax-Advantaged Structure
ARLP is the only major domestic coal producer that operates as a master limited partnership. In this hybrid form of partnership and corporation, income and deductions are passed through to ‘unitholders’. MLPs must derive at least 90% of their income from qualifying sources (e.g. real estate, mining, natural resources).
ARLP pays no income taxes and ‘unitholders’ receive a K-1 tax form. The quarterly ‘distributions’ received by investors are treated as a return of capital and are tax-deferred until the cost basis is re-couped by the investor. Once sold, this ‘adjusted basis’ is taxed at a combined income tax rate and capital gains tax. Unitholders should familiarize themselves with tax implications here.
Because MLPs avoid ‘double taxation’ and are pass-through entities, capital is returned quicker and in a more tax-efficient manner. Notably, MLPs are also exempt from the recent 1% buyback tax, which some lawmakers recently proposed to increase to 4%. While unit repurchases have only totaled $19.4M in FY2023, there remains another $94M in the buyback program.
While the payout structure may restrict the level of share buybacks compared to competitors, the sustainable distribution is ideal for income oriented investors. The company most recently maintained its $0.70 per quarter distribution for Q1, 2024. With a high capex year in 2024, it is likely we will not see meaningful unit buybacks until 2025. Notably, CEO Joe Craft owns 15% of shares, which suggests management alignment with shareholders.
Shareholder Breakdown (ARLP Presentation)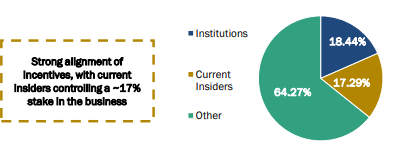
Getting Paid to Wait: Alliance’s Valuation
Cheap on a Normalized Earnings Basis
Assuming a normalized EBITDA margin of $23/ton (average of $25/ton and $20/ton margin in 2023 and 2024, respectively) and production of 35 million tons, Alliance’s coal operations generate ~$800 million in EBITDA at prevailing coal prices. The coal royalty segment generates another ~$40 million in EBITDA (21 million tons at a $2.10/ton EBITDA margin). The oil and gas royalty segment generates ~$125 million in EBITDA, assuming an 88% margin.
In total, Alliance generates a normalized $960 million in EBITDA. At a $3 billion market cap with gross debt of $440 million (includes equipment financing) and cash of $175 million, the enterprise value is ~$3.3 billion. This results in a very attractive multiple of <3.5x EV/EBITDA.
For 2024, management guided for higher-than-normal maintenance capital expenditures due to longwall moves in its River View, Warrior, Hamilton and Tunnel Ridge mines ($450 million mid-point, compared to a normalized $275 million or $7.80/ton).
Net of this maintenance capex, taxes ($18 million), growth capex ($25 million) and interest ($20 million), the Alliance should generate $450 million in free cash flow in 2024. With distributions of $90 million per quarter, the coverage (1.25X) is tight, even with the 2029 Notes refinance in the books. Although management reaffirmed the $0.90/unit distribution next quarter, note that there is risk of a temporary distribution cut in 2024.
ARLP Distributions (ARLP Earnings)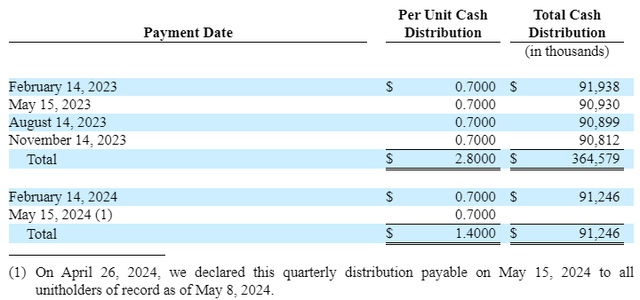
Reflecting lower capex, on a normalized basis, we can expect distributable earnings between $600 million to $675 million, which translates to a 20%+ owner’s earnings yield. This offers sufficient distribution coverage and significant leftover capital. Keep in mind, these figures are derived from revenues based on the current strip, considering no upside leverage to coal and gas pricing. Note that this analysis also ascribes no value to the non-current equity securities, equity method investments and ‘digital assets’, currently on their balance sheet.
Unlocking Shareholder Value
I believe that management has a variety of avenues through which to unlock significant value in 2025 with this cash flow. Following deleveraging, management will allocate capital to unit repurchases, the buildout of their royalty business and continued ‘new venture’ equity method investments.
There are $45 million in equity method investments and another $92 million in equity securities on its balance sheet. These include a $20 million investment in Francis Energy, an EV charging operator, a recent $25 million LP interest in a ‘low carbon’ private equity fund and $50 million in preferred stock positions in Infinitum and Ascend, electric motor and EV battery manufacturers.
ARLP Other Assets (ARLP Q1 10Q)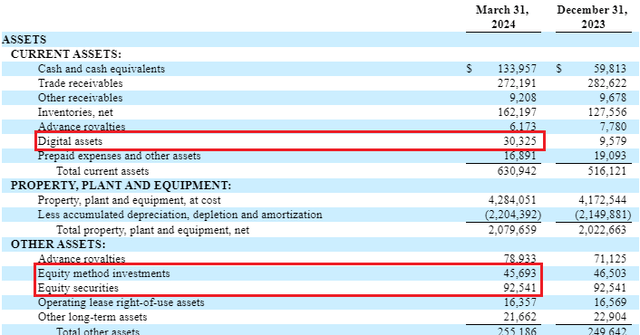
These unconsolidated investments are tough to value and are likely achieving an inferior return on capital, compared to Alliance’s core businesses, though management has made it clear they “are not interested in a portfolio of passive venture style investments.” Capital allocation to this segment is a risk to be monitored.
Even with depressed pricing in the ‘shale boom’ era, management has an extensive track record of delivering high returns on equity without meaningful top line growth. Given its tax structure, much that return has been delivered directly to shareholders through distributions.
QuickFS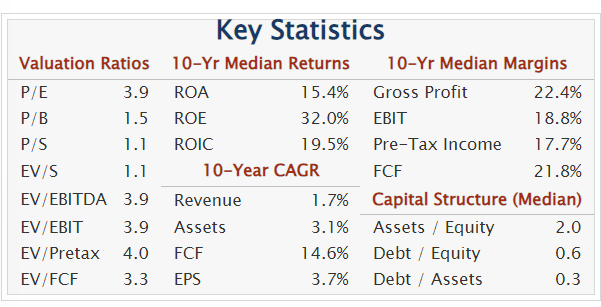
Differentiated Against Peers
The obvious advantage of Alliance against its peers is the pass through nature of its structure, which enables it to distribute a tax-efficient dividend stream to shareholders. Shares offer a significant 12% distribution yield today, well above peers.
Dividends vs. Peers (Koyfin)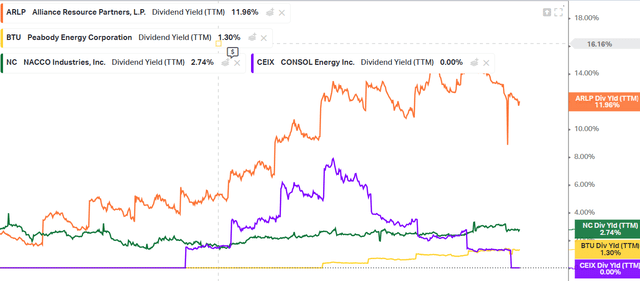
Alliance and its thermal coal peers have de-risked their balance sheets significantly in the last 2 years. Following the refinance of the 2025 Notes, ARLP will have only 0.3x turns off net leverage. With the largest American thermal coal producers trading at an average ~4x EBITDA, the sector is among the most out-of-favor corners in the markets.
ARLP Comparables (Various)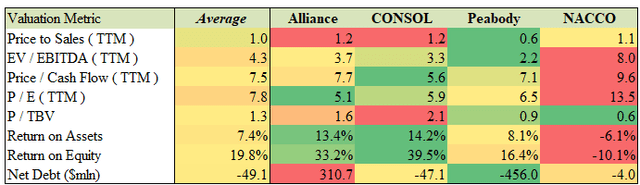
With valuations as low as today, the highest and best use of capital is share buybacks. In the past 12 months, Peabody (BTU) has repurchased 15% of its shares and CONSOL (CEIX) has repurchased 13% of its shares. Conversely, ARLP has only repurchased 0.5% of its shares.
ARLP Buyback Yield (Koyfin)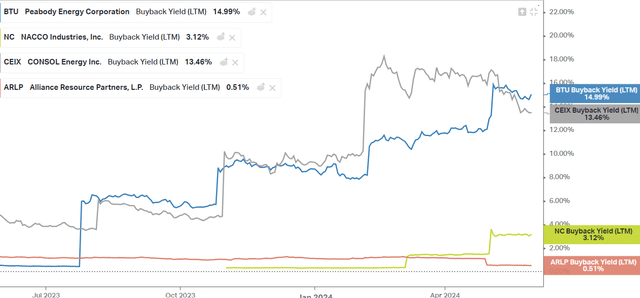
Once this year’s elevated capex budget and continued deleveraging are complete, I would like to see management increase their return of capital to shareholders via buybacks, given ARLP’s limited ability to deploy growth capital (aside from opportunistic royalty acquisitions). The current double-digit yield is sufficient to retain yield-focused investors with high distribution coverage, and buybacks could unlock significant value in the share price.
Ultimately, Alliance has unique upside compared to its peers. Peabody is spending capex dollars on developing its Australian metallurgical coal assets and CONSOL is doubling down on both met and thermal export markets. Both initiatives are capital intensive but likely offer significant upside.
Alliance is in the unique position to use years of ‘melting ice cube’ cash flows to opportunistically build a capital-light O&G royalty business, within the MLP structure, worth an EBITDA multiple 2-3x higher than what a coal business would ever trade at.
Conclusion
The domestic thermal coal market has significantly more runway than the market is pricing in. A lack of domestic natural gas storage, increasing strain on the electrical grid, energy insecurities in Europe, and growth in global coal power capacity are among the tailwinds for higher coal prices.
Alliance (and its peers) have proven to deliver significant free cash flow even in the face of near all-time low natural gas prices. With 15 years of reserves and access to thermal coal export markets through the Ohio River, Alliance is well-positioned to benefit from coal upside.
Alliance’s significant oil and gas royalty portfolio is worth nearly a third of the company’s equity value. Following a capex-heavy 2024, management will have the opportunity to unlock significant returns through share buybacks. In the meantime, shares offer a tax-efficient 12% yield and a cheap 4x EBITDA valuation.
Trading in line with peers, Alliance has not yet been given credit for the buildout of its capital-light royalty business. Through its double-digit distributions, incoming share buybacks, and management’s long-term focus on the royalty business, Alliance offers significant risk-adjusted upside at today’s valuation.
Credit: Source link