

DKosig
Author’s note: This article was released to CEF/ETF Income Laboratory members on June 16th.
International equities currently offer investors cheap prices and valuations, some momentum, but slightly below-average growth prospects. In my opinion, these characteristics and trends are a net positive, making international equities solid investment opportunities, and slightly stronger than comparable U.S. equities.
I’ll be focusing on the Vanguard Total International Stock Index Fund ETF Shares (NASDAQ:VXUS), a simple international equity fund, in this article, but everything here should apply to most broad-based international equity funds as well.
International Equities – Key Characteristics and Trends
Cheap Prices and Valuations
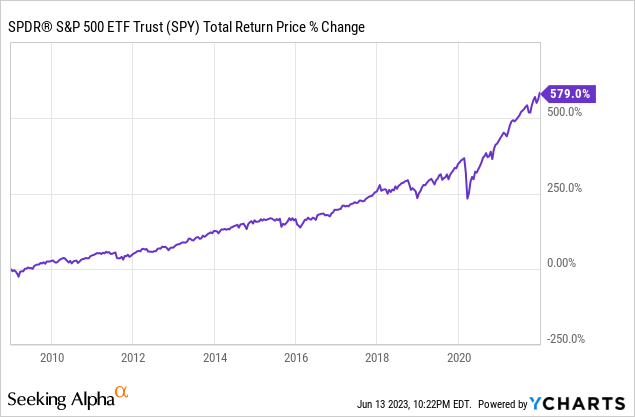
U.S. equities had an outstanding run from 2009 to 2022, seeing annualized returns of +15%, with cumulative returns of almost 600%.
Data by YCharts
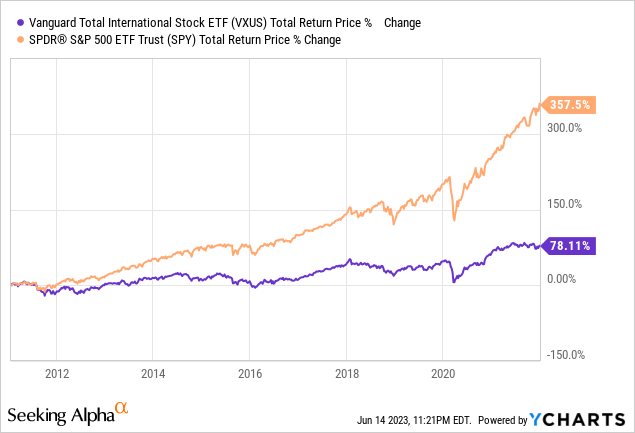
International equity returns were much weaker, around half those of the S&P 500. VXUS itself was only created in early 2011, and the fund significantly underperformed since inception until 2022, as expected.
Data by YCharts
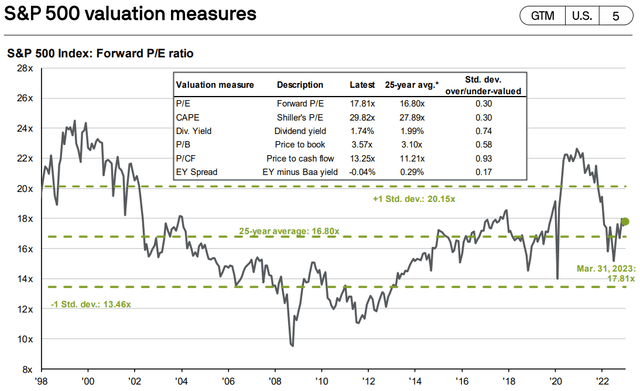
As prices soared so did valuations, with the S&P 500 going from a 12.0x PE ratio, significantly undervalued on a historical basis, to a 17.8x, slightly overvalued.
JPMorgan Guide to the Markets
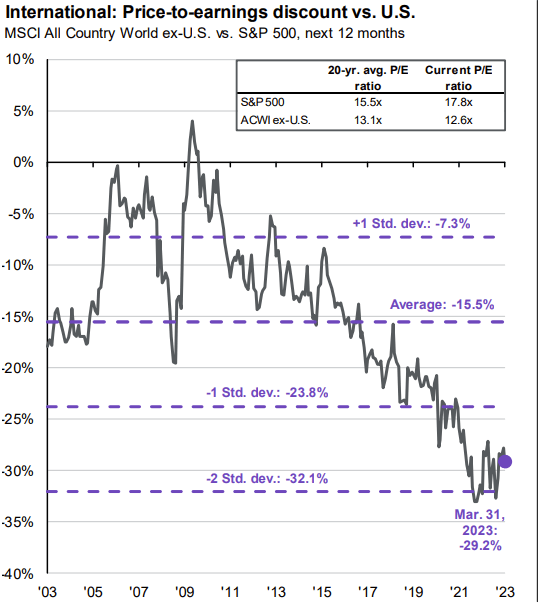
International equities saw much lower share price increases, so their relative valuations vis a vis U.S. equities improved. International equities went from trading with (roughly) the same valuation as U.S. equities, to trading with a 29.2% discount. It is a very hefty discount, and almost twice the historical average.
JPMorgan Guide to the Markets
Yield spreads have also widened, although these are much more volatile, so exact figures are difficult to calculate / not terribly informative.
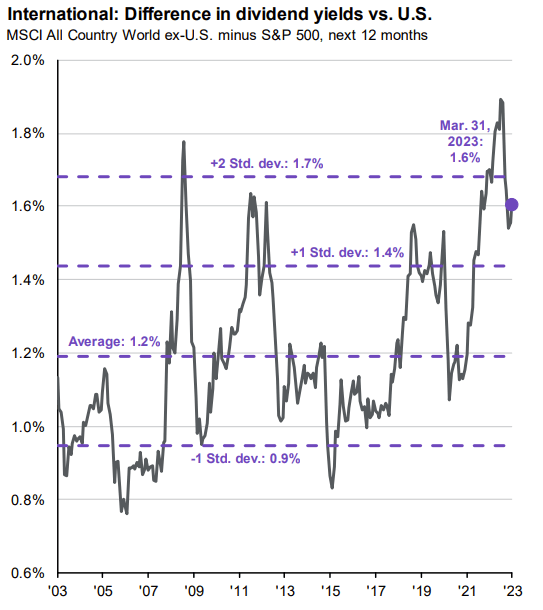
JPMorgan Guide to the Markets
VXUS itself trades with a cheap valuation as well. It currently sports a 12.3x PE ratio, a 44% discount to the S&P 500’s 22.1x, and a 3.8x PB ratio, for a 58% discount. Ratios for VXUS:

VXUS
and ratios for the S&P 500:

VXUS
In international markets, emerging market equities look particularly cheap right now. I’m partial to Latin American equities, due to their strong yields and incredibly cheap valuations. Risks are quite high too, as is volatility. Quick table on the iShares Latin America 40 ETF (ILF), the largest fund in this space.
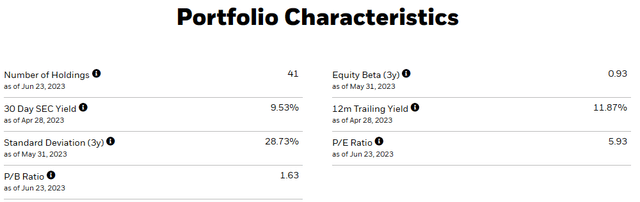
ILF
On another note, the dollar itself is currently very slightly elevated / other currencies are currently very slightly cheaper. The differences are small and not terribly material, but still thought it important to mention.
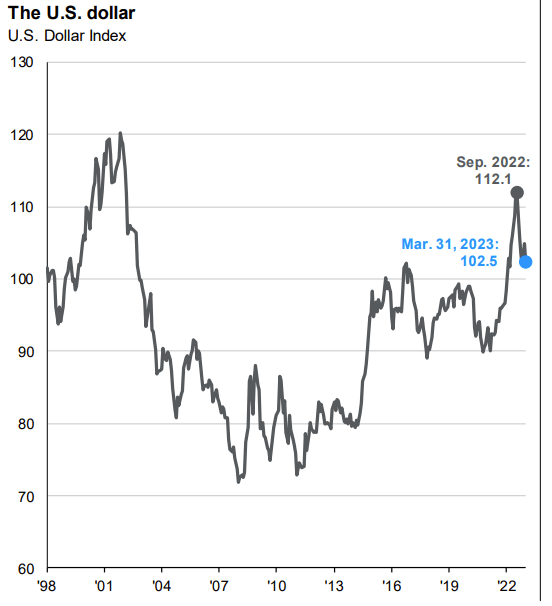
JPMorgan Guide to the Markets
Cheap prices and valuations could lead to strong, market-beating returns for international equities moving forward, which brings me to my next point.
Moderate Momentum
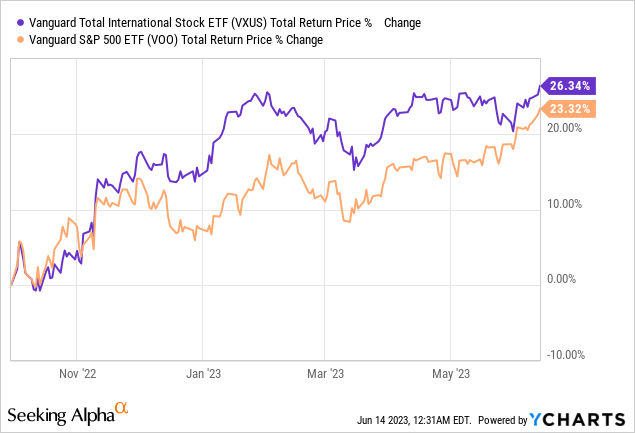
International equities are currently exhibiting moderate momentum. Returns have been very strong since at least mid-2020, and international equities have outperformed comparable U.S. equities for a little over a year.
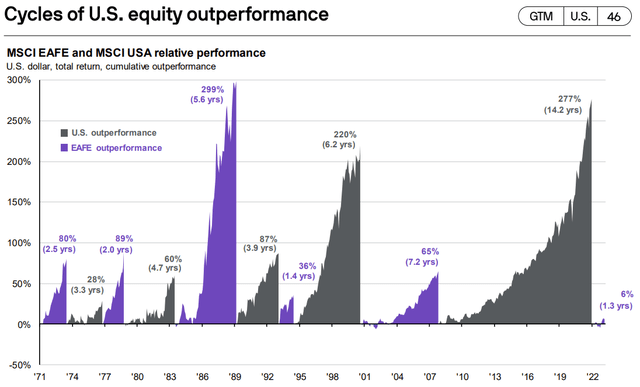
JPMorgan Guide to the Markets
On the other hand, outperformance has been somewhat inconsistent, not terribly large, and has stalled since May. From what I’ve seen, performance was particularly strong from September 2022 to May 2023, during which the dollar lost a lot of strength. Gains have been much weaker since.
Data by YCharts
In my opinion, it would be fair to say that international equities are currently exhibiting moderate momentum. Absolute returns are strong, relative returns are generally slightly above-average, and I have not noticed any significant recent issues or downsides here.
International equity momentum is indicative of broadly favorable market conditions and investor sentiment, both of which could lead to strong returns moving forward. Valuations do support further gains as well.
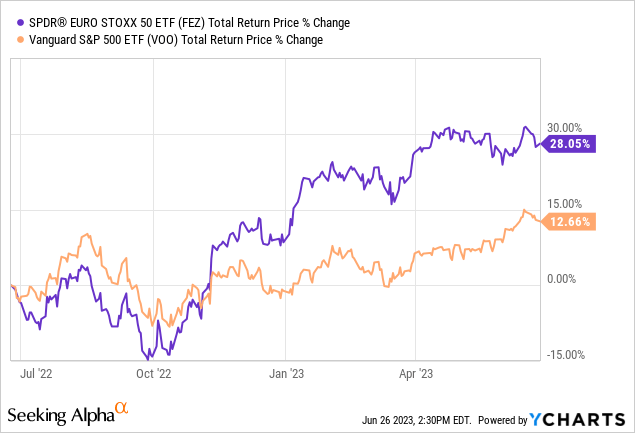
In international markets, large-cap European stocks seem to have the strongest momentum, with the benchmark SPDR EURO STOXX 50 ETF (FEZ) up 28.1% these past twelve months, more than doubling S&P 500 returns.
Valuations are quite cheap as well.

FEZ
European stocks have outperformed in the recent past due to favorable comps, the Ukraine War started in earnest last year, lower energy prices, and improved economic fundamentals and investor sentiment.
Below-Average Growth Prospects
International equities tend to grow a bit slower than U.S. equities, due to the strength and dynamism of the U.S. economy. VXUS’s underlying holdings have seen earnings growth of 9.4% these past five years:

VXUS
compared to 17.8% for the S&P 500:

VOO
Importantly, growth rates are expected to come closer in the coming years, for several reasons.
International companies were strongly impacted by the coronavirus pandemic, but the pandemic has been over for years.
International equity earnings were negatively impacted by the strengthening dollar, prices there seem to have stabilized. At the same time, the price of the dollar can only increase so much.
European equities, a key component of most international equity indexes, were severely impacted by the Ukraine War which, although ongoing, is fully priced-in already.
U.S. tech companies saw outstanding earnings growth in prior years too, as the coronavirus pandemic accelerated WFH and similar initiatives. Earnings have stalled since last year, however, partly due to a localized industry slowdown, and partly due to industry conditions normalizing (pandemic growth was never going to last).
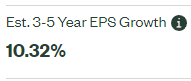
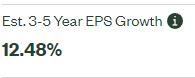
Due to the above, earnings growth for U.S. and international equities is expected to be much more closer moving forward. I was unable to find detailed data for VXUS, but the SPDR MSCI ACWI ex-US ETF (CWI) is quite close, and the underlying holdings of that fund are expected to see earnings growth of 10.3% moving forward:
CWI
versus 12.5% for the S&P 500:
SPY
The lower expected earnings growth of international equities is, of course, a negative for these companies and their investors. Nevertheless, in my opinion, their cheap valuations and moderate momentum outweigh their below-average growth prospects.
Looking at broader international markets, it seems that European equities are expected to see somewhat stronger earnings growth moving forward. Growth is due to favorable comps, and a recovery from the Ukraine War.
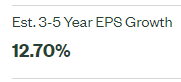
FEZ
Conclusion
International equities currently offer investors cheap prices and valuations, some momentum, but slightly below-average growth prospects. In my opinion, these characteristics and trends are a net positive, making international equities solid investment opportunities, and slightly stronger than comparable U.S. equities.
Credit: Source link