
pidjoe
The AES Corporation (NYSE:AES) has witnessed a decline in stock price over the past six months demonstrating potential value in the long term. I believe that the stock is currently a buy due to its solid dividend, portfolio optimization, and undervaluation assuming my DCF figures.
Business Overview
AES Corporation is a diversified power generation and utility company involved in the ownership and operation of power plants. It generates electricity for sale to a variety of customers, including utilities, industrial users, and intermediaries.
Additionally, AES owns and operates utilities that produce or procure electricity and distribute it to end-user customers across different sectors. The company employs a diverse range of fuels and technologies, such as coal, gas, hydro, wind, solar, biomass, energy storage, and landfill gas, to generate electricity. With a substantial generation portfolio of around 32,326 megawatts, AES operates across various regions globally, including the United States, Puerto Rico, El Salvador, Chile, Colombia, Argentina, Brazil, Mexico, Central America, the Caribbean, Europe, and Asia.
AES
AES Corporation has a market capitalization of $13.31 billion, boasting a strong return on invested capital of 19%. The stock has experienced a 52-week high of $29.89 and a low of $18.62, currently trading at $20.19. With a price-to-cash flow ratio of 4.69, AES appears to be trading in possible value territory when compared to its industry peers.
AES Price to Cash Flow Compared to Peers 1Y (Seeking Alpha)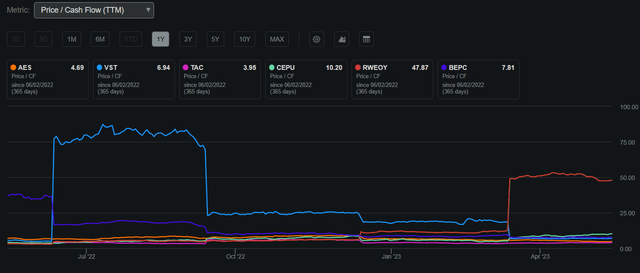
AES Corporation also offers a dividend yield of 3.34%, supported by a conservative payout ratio of 38.56%. This allows the company to reward its shareholders while still retaining sufficient free cash flow to pursue growth opportunities, leveraging its strong return on invested capital. As AES focuses on optimizing its portfolio during the transition to renewables, I anticipate that the company will be able to sustain this dividend yield as long as FCF remains stable.
Seeking Alpha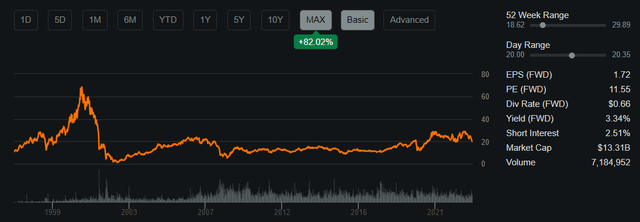
AES Corporation has reported Q1 2023 results that exceeded expectations, with earnings per share meeting estimates at $0.22 and a significant $400 million beat on revenue, totaling $3.24 billion. These results demonstrate slight outperformance despite prevailing economic headwinds. The company’s success highlights its ability to leverage its extensive geographic presence to identify growth opportunities while maintaining profitability. AES has also reaffirmed its 2023 guidance, with an adjusted EPS range of $1.65 to $1.75, compared to the consensus estimate of $1.72. Additionally, AES aims for 7% to 9% annualized growth through 2025, using 2020 as the base year. Considering these factors, I believe AES is well-positioned to achieve long-term compounding growth.
AES Compared to the Broader Market
Over the past decade, AES has shown a slightly lower performance compared to the S&P 500 when considering dividends. This underperformance reflects the company’s deliberate shift towards a long-term strategy focused on high-growth areas such as renewables. By prioritizing investments in renewable energy sources, AES positions itself to potentially outperform in the future, taking advantage of the growing demand for clean and sustainable energy solutions. This strategic pivot demonstrates AES’s commitment to adapting to evolving market trends and capitalizing on the opportunities presented by the transition to renewable power generation.
AES Compared to the S&P 500 10Y (Created by author using Bar Charts)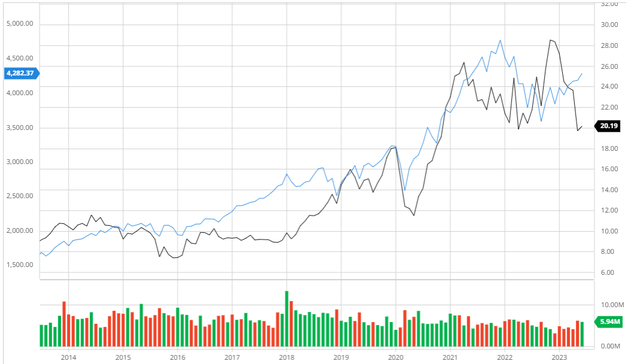
Portfolio Optimization Through Renewables Transition
AES Corporation employs a portfolio optimization strategy that includes aggressively managing its current assets and routinely scanning the market for merger, sale, and partnership opportunities. The company intends to strategically allocate resources, concentrating on areas and technologies that have the most room for growth and value generation.
The most recent acquisition of sPower by AES in 2017 serves as an illustration of this technique. One of the largest independent developers of renewable energy in the US, sPower focuses on solar and wind energy projects. Through this acquisition, AES was able to dramatically increase the scope of its renewable energy offerings and establish a presence in the quickly expanding U.S. renewable energy industry. AES had quick access to a variety of top-notch renewable assets because of sPower’s sizable pipeline of development projects.
AES was able to enhance its portfolio through the acquisition by adding a sizeable portion of renewable energy, in line with its dedication to sustainability and lowering carbon emissions. With this move, AES not only improved its position in the renewable energy market but also diversified its income sources and decreased its exposure to assets that are dependent on fossil fuels.
Furthermore, as part of its efforts to optimize its portfolio, AES has been actively involved in divestitures. The business recently declared its goal to sell all of its coal-fired power units by the year 2025, ending all revenue streams from coal. AES’s long-term commitment to lowering its carbon intensity and switching to cleaner, alternative energy sources is consistent with this strategic choice. AES can reallocate funds to green energy projects and give higher priority to areas with more room for growth by selling its coal holdings. In addition to improving its environmental sustainability, AES can better position itself for future success in the changing energy landscape thanks to this proactive approach.
Additionally essential to AES’ portfolio optimization strategy are partnerships. To benefit from their knowledge and collaborate on initiatives, the organization has forged strategic ties with other market titans. For instance, AES and Siemens formed the global provider of energy storage technologies and services Fluence through a joint venture. Through this agreement, Siemens’ technological skills and global reach were made available to AES, strengthening its position in the quickly expanding energy storage market.
I believe that this portfolio optimization initiative undertaken by AES will position the company to take advantage of long-term industry trends. By strategically reallocating its resources and focusing on segments with higher profit margins, AES will be able to generate more predictable cash flows. This, in turn, will allow the company to leverage its assets effectively, fostering growth and delivering value to its shareholders.
Fluence
Analyst Consensus
AES has received a strong buy rating from analysts over the past three months, highlighting the company’s promising long-term prospects. With a price target of $29.56, the forecasted upside potential stands at 46.39%. This optimistic outlook underscores the positive sentiment toward AES and its anticipated growth in the future.
Trading View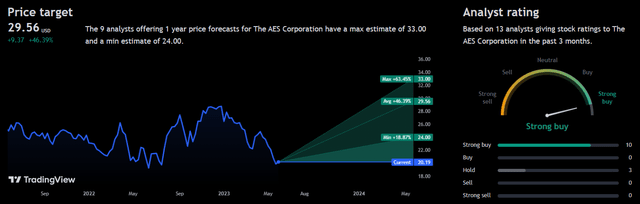
Valuation
Prior to formulating my assumptions and conducting my DCF analysis, I deemed it necessary to calculate the Cost of Equity and WACC for AES using the Capital Asset Pricing Model. By considering the risk-free rate of 3.6% based on the 10-year treasury yield, I arrived at a Cost of Equity of 7.04%, as illustrated below.
Created by author using Alpha Spread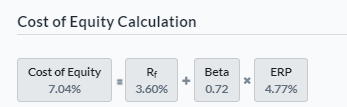
Based on the derived Cost of Equity value, I proceeded to calculate the Weighted Average Cost of Capital, resulting in a figure of 5.29%. This WACC value is below the industry average of 5.9%, as illustrated below.
Created by author using Alpha Spread
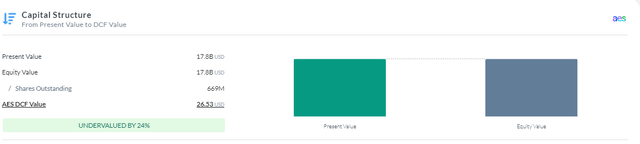
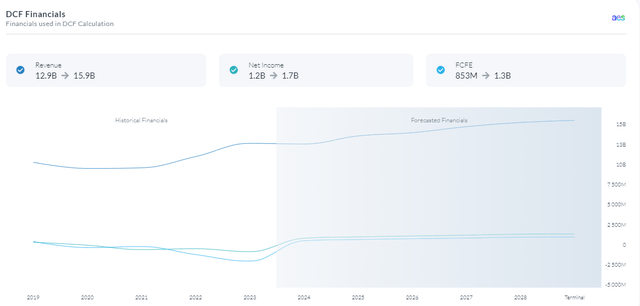
Based on an Equity Model Discounted Cash Flow analysis using Free Cash Flow to Equity, I have determined that AES is currently undervalued by approximately 24%, with a fair value estimate of around $26.53. This valuation was derived using a discount rate of 7.04% over a 5-year period. Additionally, I anticipate that AES will continue optimizing its portfolio and acquiring more efficient assets, leading to margin expansion over time.
5Y Equity Model DCF using FCFE (Created by author using Alpha Spread) Created by author using Alpha Spread Created by author using Alpha Spread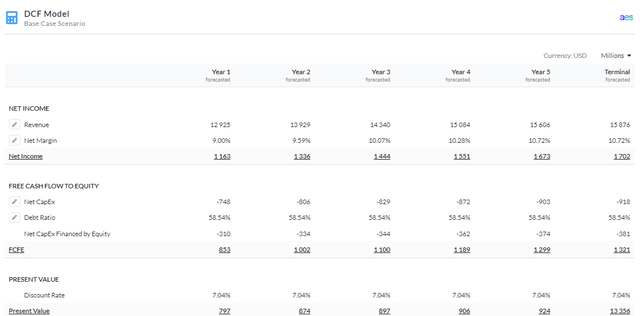
Risks
Regulatory and Policy Risks: AES’s operations could be impacted by modifications to laws and policies governing the energy industry in the many locations where it operates. Government policy changes, such as modifications to tariffs, subsidies, or environmental restrictions, could have an impact on AES’s profitability and capacity to operate in specific regions.
Market Volatility and Price Fluctuations: The success of AES’s finances is susceptible to changes in commodity prices and market instability, notably in the energy industry. The running expenses and profitability of AES may be impacted by changes in the cost of fuels like coal, gas, and oil.
Conclusion
In conclusion, considering AES’s attractive dividend, strategic portfolio optimization in renewable energy, and the undervaluation indicated by my DCF analysis, I believe that AES is a buy that would generate long-term value.
Credit: Source link