

BlackJack3D/iStock via Getty Images
Is There Growth in Your Value?
Let’s start with the part everyone already knows…
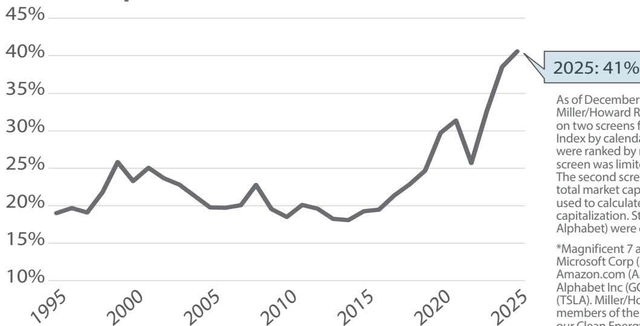
OVER THE LAST 10 YEARS, EQUITY MARKETS have witnessed unprecedented outperformance from the companies with the largest market capitalizations. As the biggest companies grew, equity markets reached record levels of concentration with the weight of the top 10 holdings in the S&P 500 Index more than doubling to 41% (from ~19%), and surpassing the Tech Bubble high of ~26% in 1999. The “Magnificent Seven” (Mag 7)* have been the poster children for this dynamic. The Mag 7 accounted for an astounding 38% of the total return of the entire S&P 500 over the last 10 years and 44% over the last five years. Over 10 years, the Mag 7 went from just 11% to 34% of the S&P 500 Index.
What may be more surprising to investors is that style-based allocation alone does not eliminate this market concentration risk nor manage exposure to a narrow set of economic drivers. At the same time, index construction is creating fewer opportunities to diversify portfolios, further complicating matters for investors.
Imagine trimming exposure to Mag 7 holdings (or growth-style in general) and reallocating that capital into a value or income product—only to find some of that money going back into the very names you just trimmed. This dynamic is becoming increasingly common.
Record Market Concentration: Top 10 as a Percent of the S&P 500 Index
Are Indices Changing?
FTSE Russell periodically reconstitutes its indices. For the Russell 1000 Growth and Value indices, this includes reevaluating the companies in their indices to determine where they lie along the investment style spectrum. Russell uses three metrics (one value-, and two growth-oriented) to calculate a composite value score for each company that reflects how strongly the position displays value and growth characteristics. The constituents are ranked and an algorithm is applied to determine style index membership weights. Since a continuous style-scoring system is used (versus a binary system), holdings can be divided and allocated across both indices. In fact, over 250 holdings were held in both the Growth and Value indices earlier this year.
The 2025 reconstitution (on June 30) marked a key moment as three mega-cap stocks shifted from pure growth to part growth and part value due to lower growth scores and higher value scores: Alphabet (GOOGL/GOOG) shifted to 65% growth/35% value, Amazon (AMZN) shifted to 73% growth/27% value, and Meta Platforms (META) shifted to 82% growth/18% value.
This is not without precedent. In 2022, Google and Meta were categorized as partially value and were added to the value index at weights of ~1.65% and ~0.9%, respectively. However, during the 2025 reconstitution, Google, Amazon, and Meta all became top 10 positions in the Russell 1000 Value due to their outsized market capitalizations, despite only a portion of their total weight being allocated to value . The three positions represented a combined ~5.5% of the Value index. Perhaps even more counter-intuitively, Google, Amazon, and Meta were top 10 holdings in both the Russell 1000 Growth and Russell 1000 Value indices at the reconstitution.
Large Shift in the Top 10 Members of the Russell 1000 Value Index
The Russell indices aren’t the only ones encountering these dynamics. S&P style indices are similar in many respects as they don’t force constituents to be 100% growth or value and allow weights to be split based on three growth factors and three value factors. The S&P 500 Index is divided roughly equally into growth and value indices with overlapping positions. S&P reconstitutes its style indices annually in December. At the end of 2024, the S&P 500 Value Index added some of the Mag 7 members with Apple (AAPL), Microsoft (MSFT), and Amazon making up the top three positions and comprising a stratospheric ~18% of the S&P 500 Value Index.
So, what’s the problem?
It’s a fair question. After all, index reconstitution is a mechanical process that is consistent and repeatable—core tenets of the passive process. It also seems fair to conclude that some companies don’t fit neatly into a style category.
If anything, the recent reconstitutions illuminate the fact that investing in passive indices requires an active decision. These indices, while not actively managing their holdings in a traditional sense, are making investment allocations based on their own key metrics. These criteria differ among providers based on what “value” or “growth” mean to the index provider. At the end of the day, we simply disagree with the output of this passive process.
Historically, investors have generally agreed that, stylistically, value is predicated on identifying securities that are undervalued relative to their fundamentals and thus offer a margin of safety, while growth is predicated on identifying securities with above-average growth expectations and emphasizes upside potential. As a result, value stocks have typically exhibited higher dividend yields, lower valuation multiples, and lower growth rates than growth stocks.
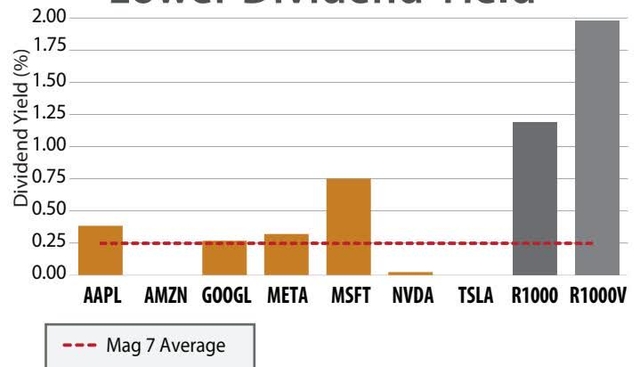
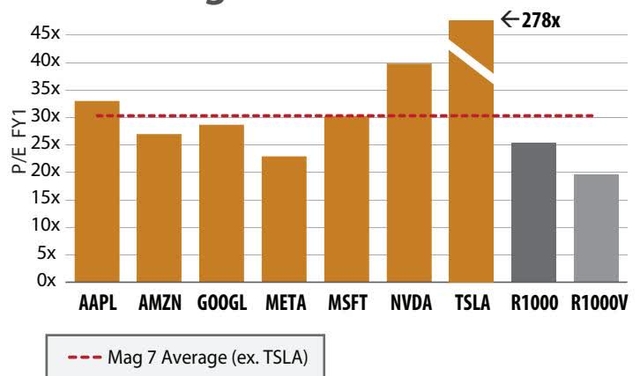
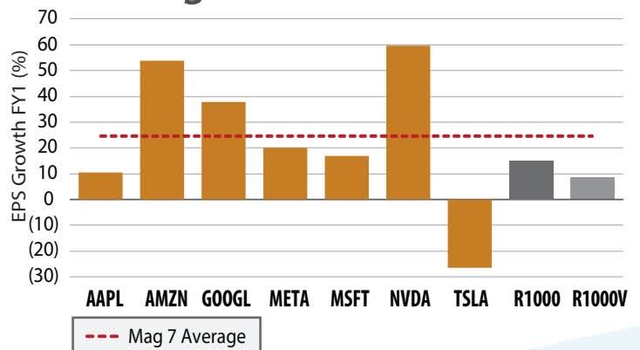
While some of the Mag 7 may have, directionally, become more value-oriented based on year-to-year changes in key metrics, we think it requires some mental gymnastics to classify the Mag 7 as being true value names. At year end, on average, Mag 7 constituents had a lower dividend yield, higher price-to-forward-earnings (P/FE) ratio, and higher growth expectations than value names and the broad market in general. The dividend yield of Mag 7 constituents was ~100 basis points lower than the Russell 1000 and ~175 basis points lower than the Russell 1000 Value. The forward P/E of Mag 7 constituents [even excluding Tesla (TSLA) which was an outlier] was four turns higher than the Russell 1000 and nearly 10 turns higher than the Russell 1000 Value. Finally, the forward earnings-per-share (EPS) growth of the Mag 7 was nearly 10 percentage points higher than the Russell 1000 and nearly 16 percentage points higher than the Russell 1000 Value.
Mag 7 Stocks Still Look Growthy
Lower Dividend Yield
Higher Valuations
Higher EPS Growth
Why Should Active Investors Care?
It would be logical for a reader to be thinking, “But I’m an active investor, so this seems like a non-event.” The unfortunate reality is that index construction impacts active management decisions.
Active managers are under constant pressure to beat index performance (and/or provide superior risk-adjusted returns, income streams, etc.). For this reason, portfolio managers are, at the very least, aware of material changes to indices. But this awareness can also influence investment decisions. The inclusion of highflyers like the Mag 7 in value benchmarks clearly adds pressure to maintain performance. At the same time, value index inclusion provides cover to add names that may not have ordinarily been consistent with an investment approach. In aggregate, these dynamics affect portfolio composition and risk.
Looking Under the Hood
Are active managers providing style diversification? We evaluated the holdings of the 25 largest (by AUM) actively-managed large-cap value separately managed accounts as categorized by Morningstar. The exercise suggests that actively-managed value portfolios have materially increased investment in the Mag 7 over the last six months.
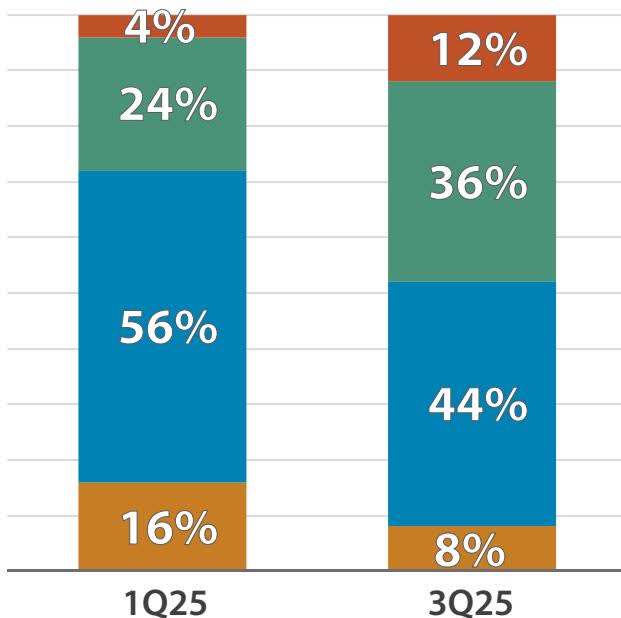
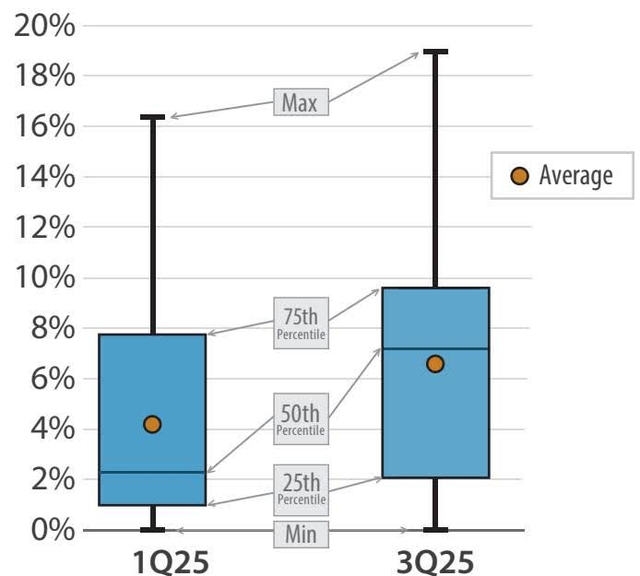
On March 31, 2025, (the quarter-end prior to the Russell reconstitution), 16% of portfolios held zero Mag 7 constituents and 72% held two or fewer. Six months later, by September 30 (one quarter post-Russell reconstitution), only 8% of portfolios held zero Mag 7 constituents and only 52% held two or fewer. In other words, nearly half of the value managers held three or more Mag 7 names . The number of portfolios holding five or more Mag 7 positions also rose to 12% (from 4%). The median portfolio allocation of US Large Cap Value SMAs to the Mag 7 increased from 2.3% to an astonishing 7.2%.
Value Managers Increased Exposure to the Mag 7
More Mag 7 Holdings
More Mag 7 Weight
It was our initial assumption that value managers would have been more likely to add Mag 7 constituents than their income-focused peers. A cursory evaluation shows the facts proved otherwise. Within our analysis, over 25% of the products evaluated had “dividend” or “income” in the product name. These products had an above-average number and above-average weight in the Mag 7.
Our goal is not to disparage competing approaches. Yes, some value managers may have purchased these securities at levels that were consistent with their investment mandate. However, we have concerns that these names compromise style integrity. Ultimately, the high Mag 7 weight within value portfolios creates the illusion of diversification while heightening exposure to market concentration risks. We see this as a unique opportunity for investors to revisit overall portfolio diversification and to ensure each product is meeting its stated philosophy, investment universe, and portfolio objective.
Diversification with High Current Income & Growth of Income
Miller/Howard’s dividend focus is embedded in our corporate DNA and has remained unchanged for over three decades. Our disciplined approach maintains a close adherence to our investible universes across our portfolios, and we do not own the Magnificent 7 in our income-oriented portfolios. We believe this makes for differentiated portfolios that are consistent to their objective for high current income and growth of income compared to many other products in the market. While the investment landscape and products may continue to shift, we strive to continue to provide a truly diversifying income solution for investors.
Assessing the Nuclear Landscape
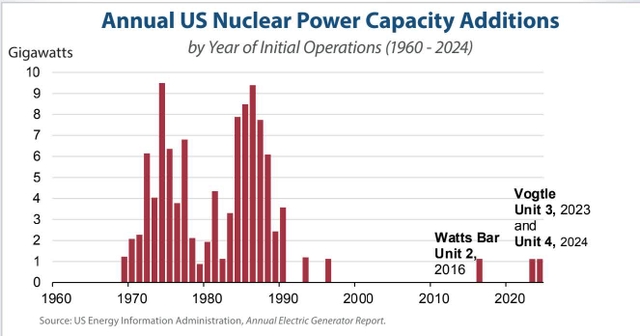
AFTER A RAPID EXPANSION OF US NUCLEAR power capacity in the 1970s and 1980s, the industry has seen limited new development over the last 30 years. Since 1990, the US nuclear industry has supplied ~20% of total US electricity. This could be changing as the US finds itself on the cusp of a nuclear renaissance. The combination of rising electricity demand, policy support, desire for clean energy solutions, and emerging nuclear technologies is creating the foundation for a long-term expansion of nuclear capacity. While the sector has been gathering momentum, regulatory, economic, and execution risks leave many key questions unresolved.
Rising Electricity Demand
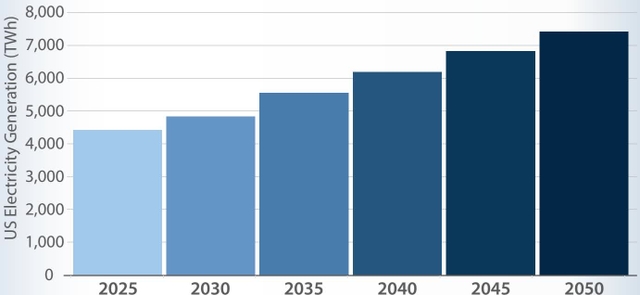
US electricity demand—which has been flat for 20 years due in large part to efficiency gains—is expected to return to growth, driven by data centers, reshoring of manufacturing, and electrification trends. The EIA expects US electricity generation to grow by 1.7% in 2026. Electricity system planning reports suggest growth is expected to continue, and even accelerate, over the next 15 years. North American Electric Reliability Corp’s (NERC) Long-Term Reliability Assessment, published in December 2024, noted, “Electricity peak demand and energy growth forecasts over the 10-year assessment period continue to climb; demand growth is now higher than at any point in the past two decades.” NERC expects peak demand to rise by 15% to 20% over the 10-year period. National Renewable Energy Laboratory’s (NREL) mid-case scenario report suggests generation will need to increase by ~25% over the next 10 years.
As demand marches higher, traditional dispatchable energy is simultaneously facing headwinds to growth. For most of the last two decades, coal-fired power generation has declined as plants have been retired. This trend seems likely to continue. Through 2030, the EIA has identified over 25 GW of coal-fired plant retirements. While the political landscape has become more supportive of coal, we expect support to be focused on extending the life of existing plants rather than undertaking significant new builds. For many years, natural gas-fired generation has been the primary replacement for declining coal-fired generation. Recent electricity demand trends have added yet another growth driver for natural gas generation. However, natural gas turbine manufacturers (OEMs) are currently reporting over three-year lead times until delivery. Expanding development timelines could encourage developers to explore nuclear alternatives, particularly at a time when data centers have been willing to sign agreements at premium prices for nuclear generation.
NREL Mid-Case Generation Forecast
Policy and Public Support
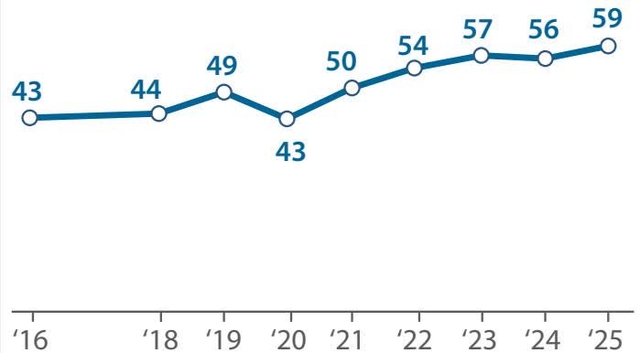
There is renewed public support for nuclear development—a shift that was once considered unthinkable in the wake of incidents at Three Mile Island, Chernobyl, and Fukushima. According to a survey by the Pew Research Center, support for nuclear generation has steadily increased over the last 10 years with 59% of adults now favoring the use of more nuclear power. The survey also suggested that a majority of adults favored nuclear development regardless of political affiliation. Nuclear energy can also contribute to a shift away from high-carbon-intensity electricity generation. Pew also states, “Among those who favor more nuclear power, the most common reason why [40% of respondents] is that it is a clean or low-carbon way of producing energy.” To this point, nuclear development has received regulatory and legislative support under the last two administrations.
Initially, support was largely economic as nuclear power plants faced pressure from low electricity prices driven by low natural gas prices and renewable energy. In November 2021, the Infrastructure Investment and Jobs Act (IIJA) was passed. The bill included a nuclear credit program intended to provide financial support to economically stressed plants. The program was similar in many ways to previous state zero-emission credit programs, but it expanded their reach to the federal level. The bill also included funds for the Advanced Reactor Demonstration Program (ARDP) that was designed to help finance development of advanced reactors (e.g., the TerraPower project in Wyoming). The Inflation Reduction Act (IRA), passed in 2022, further altered the economics of nuclear development and put it on level ground with wind and solar. In addition to providing credits for new developments, the bill provided a production tax credit for existing reactors that helped to create a floor and preserve the existing nuclear fleet. The One Big Beautiful Bill Act ultimately accelerated the phase out of tax credits for solar and wind, but nuclear credits were largely maintained.
More recently, emphasis has shifted toward accelerating and streamlining development. The ADVANCE Act, passed in 2024, sought to reduce regulatory friction and speed up licensing. The bill directed the US Nuclear Regulatory Commission (NRC) to provide regulatory guidance on new technologies and on repowering coal sites, to reduce licensing application fees, and to authorize increased staffing. In 2025, a series of executive orders expanded on these nuclear ambitions and targeted a quadrupling of US capacity by 2050 (+300 GW). This incredibly ambitious target implies capacity additions of ~12 GW/year, well above the historic peaks achieved in the 1970s and 1980s. To enable such a rapid expansion, orders focused on expedited approval, faster testing, strengthening the domestic fuel cycle, and military installations.
Majority of Americans Continue to Support More Nuclear Power in the US
% of US adults who favor more nuclear power plants to generate electricity in the country
Support for nuclear generation is beginning to translate into tangible results. After over a decade of decommissioning (US nuclear generating capacity peaked in 2012), nuclear plants are delaying closings and shuttered plants are being restarted. After being closed because of economic pressure, the Palisades Nuclear Plant (MI), Crane Clean Energy Center (PA), and Duane Arnold Energy Center (IA) are all expected to restart before the end of the decade; the Palisades Plant is currently expected to be the first previously retired nuclear plant in the US to return to operating status. While other plants are also being evaluated for restarts, there is a limited opportunity set. These restarts are low hanging fruit in a nuclear acceleration, however long-term growth will be predicated on new builds.
Small Modular Reactors
The completion of Units 3 & 4 at the Vogtle Nuclear Plant in 2023 and 2024, respectively, accounted for two of the three US nuclear units completed in the last 30 years. The third, the Watts Bar Unit 2, was completed in 2016 after being halted in 1985. The two Vogtle units had a combined nameplate capacity of over 2 GW, making it the largest in the US. Construction at the reactor sites commenced in 2009. After a series of construction delays and cost overruns, the units were completed seven years behind schedule and at a total capital cost of over $30bil—over double the project’s original estimate.
Due in part to the challenges experienced in constructing large scale nuclear reactors, focus is shifting to emerging technologies such as small modular reactors (SMRs, a class of small nuclear reactors). As the name implies, these reactors are modularly constructed and smaller in physical size and capacity. Commercial SMRs have been designed to deliver 5MW to 300MW; many SMRs work in the range of ~75 MW which is enough to power ~60,000 US homes. For context, each of the units at the Vogtle plant generates ~1,100MW. SMRs also utilize passive safety systems which enables them to cool themselves without power or human action.
SMRs provide multiple advantages compared to large-scale reactors. Due to their size and design, SMRs can be installed onto the grid or utilized independently off the grid, and they can be sited on locations that are not suitable for larger nuclear power plants. Siting flexibility took a major step forward when the NRC issued a rule effectively reducing the size of the Emergency Planning Zone (EPZ) for SMRs. This allows SMRs to be built next to data centers or on existing coal plant footprints (utilizing existing electric infrastructure) without the need for emergency planning considerations. Their scale and flexibility also match the needs of data centers. Recent data center announcements have power demands ranging from 50 MW to 2 GW. Given the wide range of potential outcomes, developers could potentially stack the required number of SMRs to service their design. The prefabricated units can be factory-assembled and transported to a location for installation. As a result of the scale and production benefits, SMRs have lower capital costs for developers and accelerated deployments. SMRs are expected to have development timelines of five to seven years (including a ~36-month licensing timeline and 18- to 36-month construction timeline). This compares favorably to the 10+ year time frame to build a traditional reactor.
Interest in SMRs has been accelerating and has culminated in a wide range of transactions. Hyperscalers have been among the most active, signing multiple power purchase agreements for SMR offtake. Utilities and industrial manufacturers have also announced plans to pursue SMR development.
Questions Remain
The most obvious impediment to SMR proliferation is the lack of proof of concept. SMRs are still very much an emerging technology, and regulatory, manufacturing, and installation timelines are still evolving. While there are SMRs operating in Russia and China, no US SMR has achieved commercial operation. Within the US, most of the SMRs under evaluation or development are targeting commercial operation near the end of the decade.
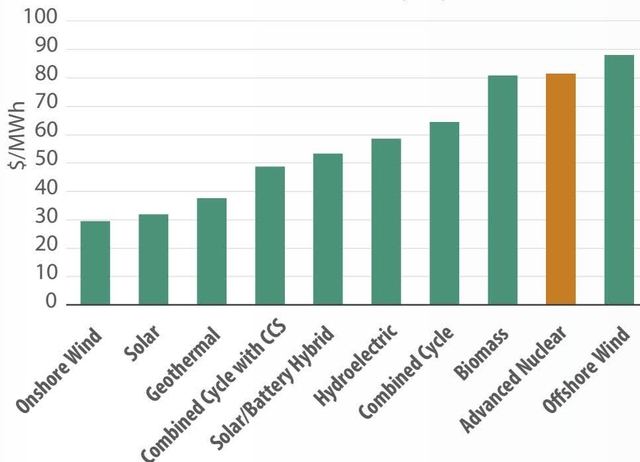
Like their larger peers, SMR developments have not been immune to cost overruns. Cost overruns have plagued early SMR development. The previously mentioned SMRs in Russia and China were completed at over 300% of their original cost estimates. Within the US, NuScale’s Carbon Free Power Project (SMRs) was terminated in 2023 after project costs rose to $9.3 billion from an earlier estimate of $5.3bil; the project’s final estimate of the levelized cost of electricity (LCOE) jumped to $89/MWh from $58/MWh. This is to be expected with a first-of-its-kind development, further demonstrating that the industry is in an early stage of development. Nuclear development in the US will likely be influenced by the cost trajectory of SMRs. The EIA’s Levelized Cost of Energy (LCOE) estimates (including tax credits) for new resources entering service in 2030 put nuclear at the high end of the cost curve at $81.45/MWh.
While LCOE does not capture all factors contributing to investment decisions—system reliability chief among them—it is useful in evaluating trends. A Department of Energy (DOE) study estimated a 2030 LCOE for SMRs and large nuclear reactors of $118/MWh and $104/MWh, respectively (excluding tax credits). By 2050, the report suggests the LCOE for SMRs and large reactors will drop to $74/MWh and $80/MWh, respectively. The change is driven by a reduction in the “overnight capital cost” (a method of comparing capex for power plants) as SMR builders incorporate learnings over time. If SMR construction timelines were to fall to 24 months, from the DOE’s assumption of 55 months, we believe SMR LCOEs would be below $70/MWh and, importantly, competitive with natural-gas combined-cycle turbines.
We view nuclear power generation as an exciting and growing opportunity set within the essential services space. We will continue to assess the risks and opportunities as the industry continues to develop.
Nuclear is at the High End of the Cost Curve – Levelized Cost of Energy by Source
Original Post
Editor’s Note: The summary bullets for this article were chosen by Seeking Alpha editors.
Credit: Source link