
PM Images
Investment Thesis
The iShares Micro-Cap ETF (IWC) might be more popular, but the First Trust Dow Jones Select MicroCap Index Fund (NYSEARCA:FDM) is the superior choice in this often overlooked category. As I will demonstrate, FDM’s selections are better valued, less risky, and are more profitable, which should lead to higher long-term returns. To be sure, there are some major risks to consider, including the difficulty in predicting the timing of risk-on environments that typically favor smaller stocks. As such, I’ve only assigned FDM a “hold” rating, but keep this one on your radar if you have an appetite for risk, and I look forward to taking you through how the strategy works in more detail below.
FDM Overview
Strategy Discussion
FDM tracks the Dow Jones Select Microcap Index, which launched on June 27, 2005, exactly three months before FDM’s inception date. The Index is float-adjusted market-cap-weighted, reconstitutes annually in August, and selects from an eligible universe defined as the bottom two deciles by market cap for all NYSE-listed stocks. Afterward, the universe is narrowed down by the following size and liquidity indicators:
- Within the top 1,000 stocks by full market capitalization.
- Within the top 1,000 stocks by three-month average value traded.
- Within the top 1,500 stocks by one-month average value traded.
The remaining universe is ranked on five financial indicators, as follows:
- Trailing P/E (highest 20% excluded)
- Trailing P/S (highest 20% excluded)
- Per share profit change for last quarter (lowest 20% excluded).
- Operating profit margin (lowest 20% excluded)
- Six-month total return (lowest 20% excluded).
Lastly, the process removes stocks with negative or missing P/E ratios or negative operating profit margins. You might be surprised at how many stocks these reasonable screens eliminate. While IWC has 1,457 equity holdings, FDM only holds 157. That’s what the “select” part of the ETF’s name signifies. It uses standard value and quality screens to improve the portfolio’s financial health, and although this decreases diversification, it’s necessary to avoid substantial underperformance when micro-caps fall out of favor.
Performance Analysis
These basic screens have historically been successful. Since October 2005, FDM has delivered a 281.06% total return (7.33% annualized) compared to 186.64% (5.72%) annualized for IWC. There’s no need to adjust for fees, as both ETFs have the same 0.60% expense ratio. Simply put, FDM’s Index has proved superior in the long run. However, its $181 million in assets under management is only a fraction of IWC’s $882 million.
Portfolio Visualizer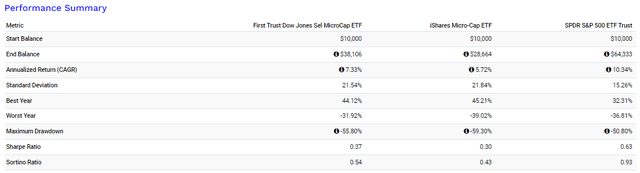
When you buy quality and value, you purchase downside protection, and we see that in FDM’s superior risk-adjusted returns. FDM’s Sharpe and Sortino Ratios are better than IWC’s, outperforming by 7% in 2008, the last major recession. Some downside protection is prudent since the Sahm Rule was triggered earlier this month. This rule indicates the economy is in or likely to be in a recession soon when the unemployment rate rises 0.50% above its twelve-month low. It’s a “rule” because it’s coincided with every recession since 1960.
St. Louis Federal Reserve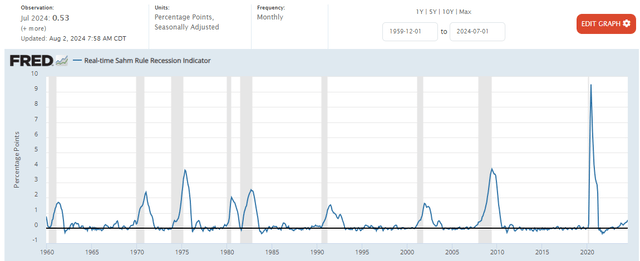
Returning to performance, FDM only substantially underperformed IWC once over its long history. As shown below, it lagged behind by 24.97% in 2020, which supports an argument that IWC is much more speculative. Still, FDM’s median annual outperformance between 2006 and 2023 was 1.10%, beating IWC in 10/18 years. Even in years when it underperformed, it was only by 2.77% on average (excluding 2020), so investors are not missing out on much growth potential by taking the safer route with FDM.
Portfolio Visualizer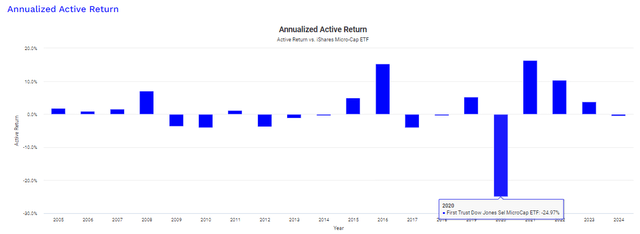
FDM Analysis
Sector Allocations
Financials comprise 28.94% of FDM, 22.00% of which are small regional banks with market caps between $126 and $907 million. It seems excessive, but considering they account for about 17% of IWC, it’s something micro-cap ETF investors must accept.
First Trust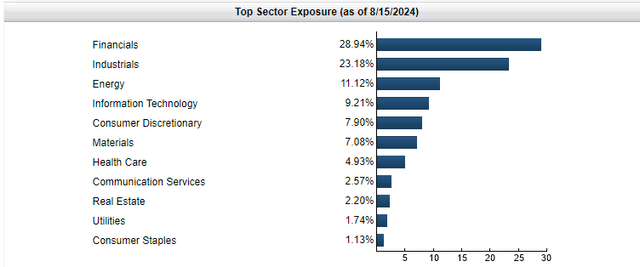
FDM also overweights Industrials by about 9% but has about 20% less exposure to Health Care, accomplished primarily by avoiding unprofitable biotech stocks.
FDM Fundamentals By Sub-Industry
The following table highlights selected fundamental metrics for FDM’s top 25 holdings, totaling 74.40% of the portfolio. Surprisingly, this isn’t much more concentrated than IWC’s 65.95% figure, which softens IWC’s “superior diversification” argument. Based on my read of the methodology document, this was not by design, but it does alleviate some of my concerns about FDM being too reliant on only a handful of segments.
The Sunday Investor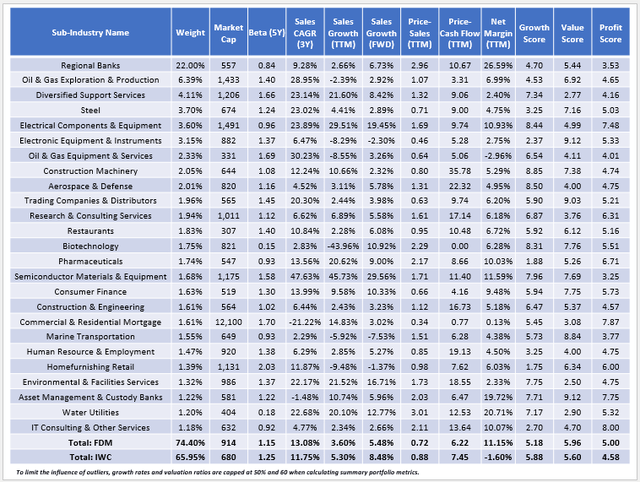
Here are three additional observations to consider:
1. FDM has a lower five-year beta (1.15 vs. 1.25), consistent with the lower volatility it’s experienced historically. It’s partially attributed to overweighting Regional Banks, which have a 0.84 five-year beta. However, it’s more related to FDM underweighting biotech stocks by about 12%. To illustrate, consider how the Virtus LifeSci Biotech Clinical Trials ETF (BBC) experienced a 67.16% drawdown between March 2021 and October 2023. This statistic is relevant because nearly half (45%) of BBC’s holdings are in IWC.
Portfolio Visualizer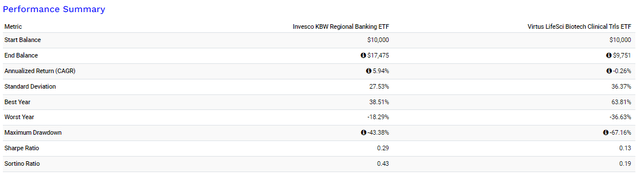
Therefore, even though I have reservations about Regional Banks, IWC’s solution to overweight these speculative stocks is no better from a risk or return perspective. This table, which covers the period between January 1, 2015, and August 16, 2024, also highlights how the Invesco KBW Regional Banking ETF (KBWR) was the better performer by far, even after the crisis early last year.
2. FDM trades at 0.72x sales and 6.22x cash flow and has a sector-adjusted 5.96/10 value score, which puts it in the top six percentile among the 900+ U.S. Equity ETFs I track. Undoubtedly, it’s a great value play, and I also come to the same conclusion by analyzing its annualized active return vs. the SPDR S&P 500 ETF (SPY). As shown below, FDM has lagged behind SPY by 15.08% YTD after missing by 13.44% in 2023. Arguably, micro-caps are due for a value re-rating.
Portfolio Visualizer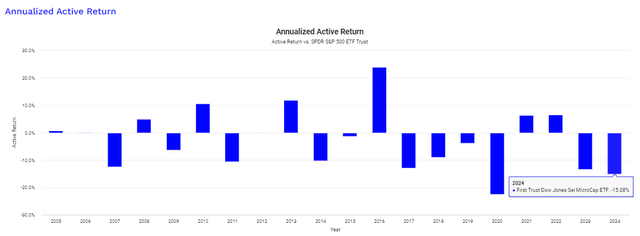
Another catalyst could be the election of Donald Trump. In 2016, expectations of deregulation and tax cuts provided the foundation for domestic micro-cap stocks to outperform. This time around, we should expect more of the same. According to the 2024 Republican Party Platform, “Cut Regulations” and “Make Trump Tax Cuts Permanent” are the party’s top two economic commitments. In addition, the proposal of a 10% universal tariff on all U.S. imports could benefit U.S. companies initially, but it would eventually contribute to higher inflation. It’s a delicate balance that’s difficult to get right, but I believe there will be a temporary opportunity should Trump win in November.
3. FDM has a 5.18/10 sector-adjusted growth score backed by 3.60% and 5.48% one-year trailing and forward sales growth rates. These figures are lower than IWC’s and, in my view, FDM’s primary weakness. However, FDM’s three-year historical growth rate is better (13.08% vs. 11.75%), mainly because of it overweighting commodity-linked sub-industries like Oil & Gas E&P and Steel and underweighting Biotechnology, whose sales were relatively low over the last three years (2.83% annualized). FDM is also a higher-quality fund, as evidenced by its 5.00/10 profit score. While the score obviously isn’t great, it does reflect the Index’s basic profitability screens that provide some stability in a challenging category.
Investment Recommendation
The micro-cap space is highly volatile and one I tend to avoid because of its unpredictability and my preference for high-quality companies. Still, micro-caps can outperform in risk-on environments, and I expect there could be a short-term opportunity soon. Catalysts include Donald Trump’s potential re-election in November or even a simple value re-rating, given how micro-caps have lagged behind substantially over the last two years.
If this category interests you, I strongly prefer FDM over IWC. Although it’s less popular, consider that FDM:
- has an identical 0.60% expense ratio.
- has a lower five-year beta (1.15 vs. 1.25) based on current holdings.
- has a superior long-term track record on both return and risk.
- is more attractively valued based on sales and cash flow.
- promotes quality through screens for profit change and operating margins.
IWC proponents might argue it’s better diversified, and although that’s technically accurate, it’s only accomplished through overweighting 150+ non-profitable biotech stocks. In my view, that defines “diworsification”, and the recent returns of BBC suggest it’s not a sector you want to overweight. Therefore, I’ve assigned a neutral “hold” rating to FDM, and although IWC wasn’t the focus of today’s article, my rating certainly would be a “sell.” Thank you for reading, and I look forward to your comments below.
Credit: Source link