
VanderWolf-Images
Company Description
Lockheed Martin Corporation (NYSE:LMT) is a global security and aerospace company engaged in advanced technology systems and their associated products and services. LMT’s key markets include defense, space, intelligence, homeland security and information technology.
The business environment is heavily regulated and the vast majority of LMT’s programs involve the US government as either the direct customer or the approver of programs involving foreign governments. Currently 73% of revenues are to the US government and the remainder are to foreign governments via contracts involving the US government.
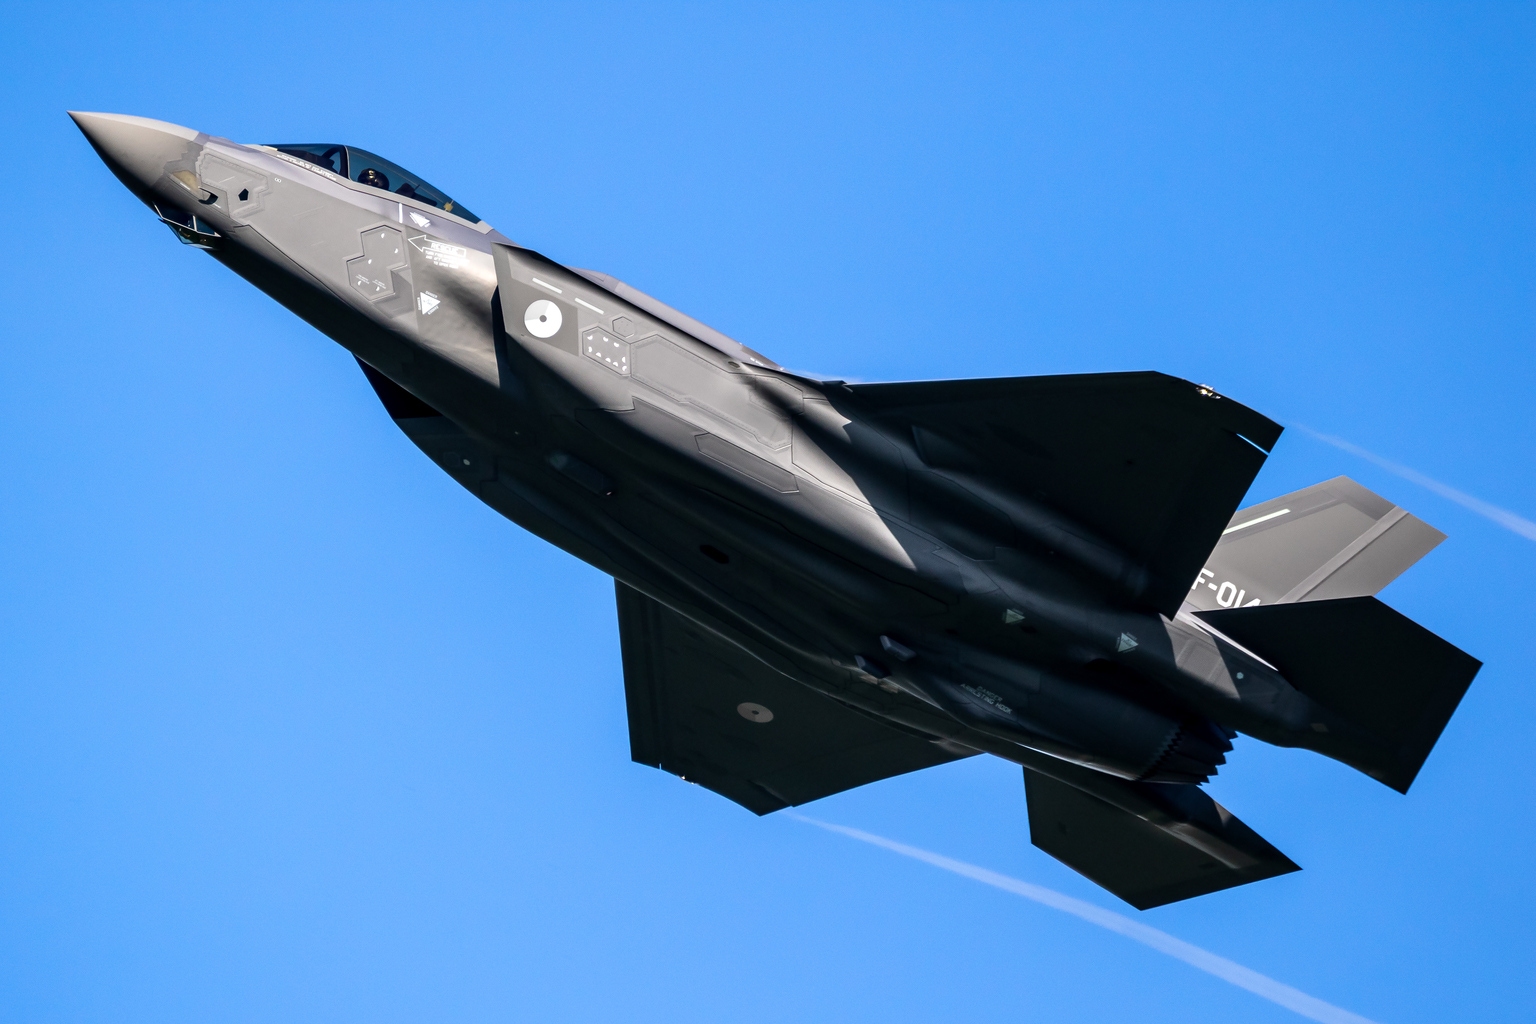
LMT’s largest program is the F-35 stealth fighter aircraft, and it represents 26% of the current total consolidated revenues.
The company started in 1912 as an aircraft manufacturer and it remains an important division. LMT has also been a major supplier to the space industry since the origins of the space program.
LMT currently has a market capitalization of $US104 billion which makes it about the 120th largest listed company in the US and the 4th largest company in the global aerospace and defense sector (with Boeing being the largest).
The company has four reportable market operating segments and provides allocated divisional operating margins:
Author’s compilation using data from Lockheed Martin’s FY2023 10-K filing.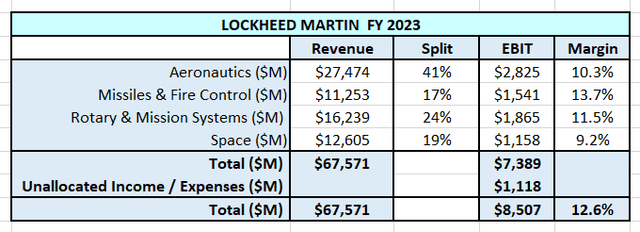
Business Overview
The geopolitical macro environment is very influential on LMT’s growth prospects. Political tensions between countries and the economic priorities of the US government essentially determine LMT’s near-term revenues.
The following chart shows the historical US military budget in actual dollars and as a percentage of the US gross domestic product:
Author’s compilation using data from the World Bank.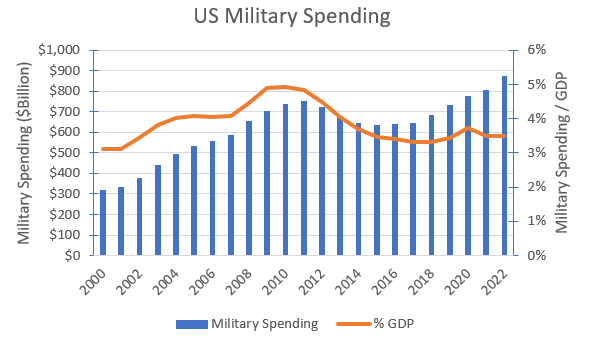
Since FY2015, the US military spending has been reasonably constant at 3.5% of gross domestic product (GDP). Over this period, spending has been growing at a reasonably steady 4.7% compounding per year.
I have completed a regression analysis of the US military spending with LMT’s reported revenues going back to FY1992:
Author’s compilation using data from the World Bank and Lockheed Martin’s 10-K filings.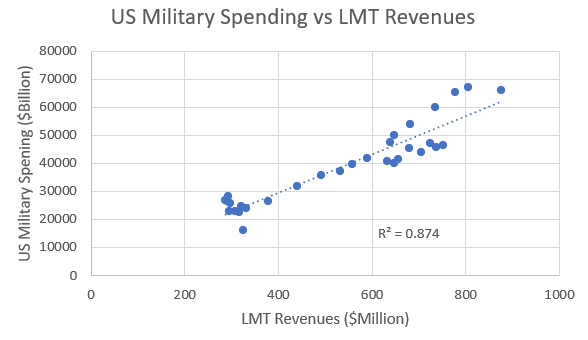
The regression analysis generated an R2= 87% (this is generally thought to be very high). The analysis indicates that 87% of the variance in LMT’s revenues can be accounted for by the variance in the US government’s military budget.
Politics in the US and in most parts of the western world has become increasingly adversarial. In the US it is very difficult to get political agreement on the size of the total government’s budget and the allocations to the major cost buckets within the budget. If this environment were to persist then I suspect that it will be difficult to substantially change the future allocations to military spending unless a major regional war was to start.
According to the North Atlantic Treaty Organization’s website, in 2006, the NATO Defense Ministers agreed to commit a minimum of 2% of their GDP to defense spending. Many countries within the alliance still do not meet this spending commitment. With the increase in military tensions throughout the world over the last few years, the non-compliance to the spending commitment has caused much angst amongst member countries.
In 2023, NATO Leaders agreed to a new Defense Investment Pledge and renewed their commitment to meet the 2% of GDP target. The NATO commitment potentially should lead to additional revenues for LMT over the medium to long-term.
LMT routinely reports its Book to Bill ratio which reflects the near to medium term order book as a proportion of the prior year’s revenues:
Author’s compilation using data from Lockheed Martin’s 10-K filings.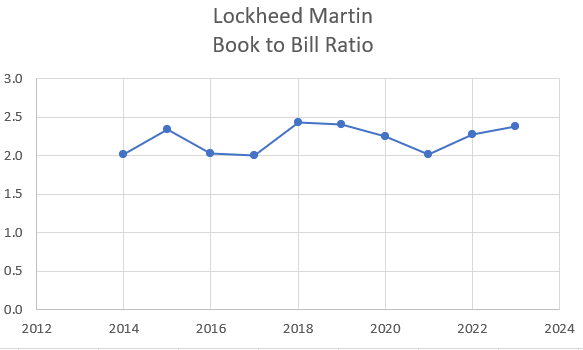
The chart shows just how stable LMT’s business is. There has been relatively little fluctuation in this metric over the last 10 years. Time will tell whether the NATO pledge causes a spike in this metric.
LMT’s Strategy
LMT’s strategic vision, termed 21st Century Security, was communicated to its stakeholders during FY2022. The vision calls for the integration of its new and existing systems across all domains using advanced, open architecture networking and operational technologies with the goal of making defense forces more agile, adaptive, and unpredictable.
LMT has identified that the key to its strategy is to develop differentiating technologies relative to its competitors.
Supporting LMT’s strategy is a significant research and development commitment as shown in the following chart:
Author’s compilation using data from Lockheed Martin’s 10-K filings.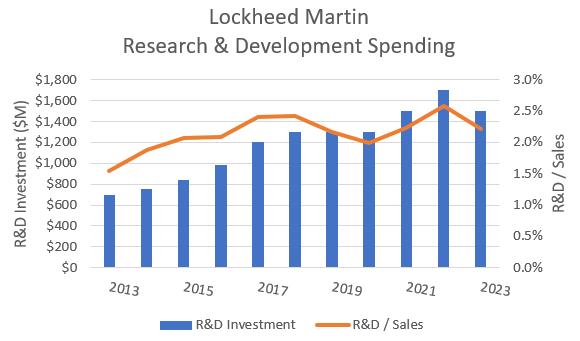
The median R&D / Sales ratio in the aerospace and defense sector is 1.1%. Over the last 10 years LMT has expanded its R&D ratio from the sector median to a level that is now more than double that of a typical company in the sector.
I must admit to being surprised that LMT’s R&D ratio is not substantially higher given the technological challenges that must exist in the sector. I suspect that LMT’s investment may be significantly higher, but it is masked by the way that the US government remunerates LMT.
LMT acknowledges that the US government directly funds some of its R&D activities and the company does not publicly report these amounts therefore they are not included in this ratio.
Lockheed Martin’s Historical Financial Performance
Revenues and Operating Margins
LMT’s historical consolidated revenues and adjusted operating margins are shown in the chart below:
Author’s compilation using data from Lockheed Martin’s 10-K filings.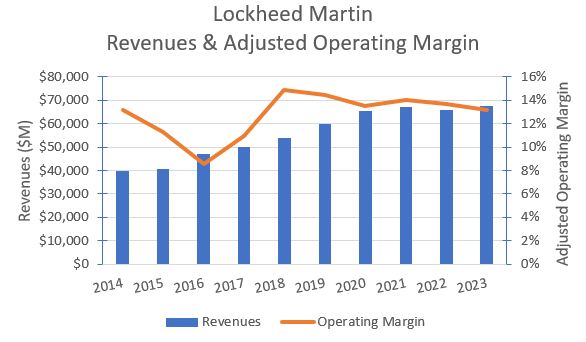
It should be noted that I have made an adjustment to LMT’s reported Operating Income by eliminating the impact of expensing R&D and any one-off gains or losses.
Over the last 10 years, revenues have grown on average by 4% per year whilst operating margins have been reasonably steady.
Typical global sector operating margins are 8.4% and the data indicates that LMT’s margins are closer to the sector’s 75th percentile.
Cash Flows
he following table summarizes LMT’s cash flows for the last 10 years:
Author’s compilation using data from Lockheed Martin’s 10-K filings.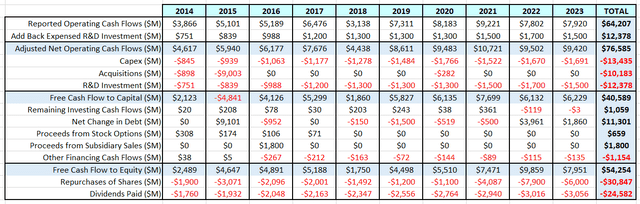
LMT’s operations have generated $40,589 M in free cash flow after reinvestment. Debt was increased by $11,301 M and after netting out some other minor sources of cash – this means that there was $54,254 M available to return to shareholders.
LMT paid out $24,582 M in dividends and spent $30,847 M on buying back shares.
The dividend appears to be very safe as it is easily covered by the free cash flow. It has increased every year since FY2002 and I see no reason for this not to continue.
LMT appears to be maintaining its debt ratio close to the sector’s median and its cash balance is flexed up and down depending on the company’s market capitalization and its operational liquidity needs. The level of share buybacks has become the mechanism for drawing down the cash balance. I expect that this will also continue.
Capital Structure
The following chart shows the history of LMT’s capital structure:
Author’s compilation using data from Lockheed Martin’s 10-K filings and market capitalization data from GuruFocus..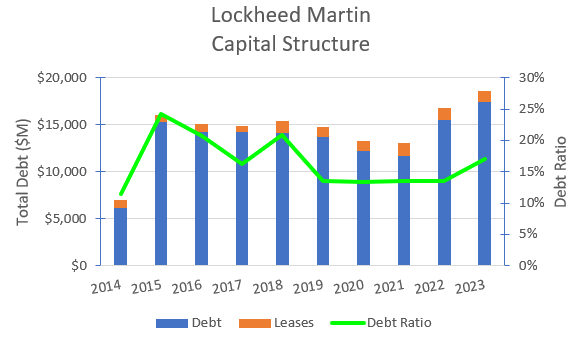
LMT’s debt ratio roughly follows the global sector’s median level (currently just above 13%). LMT has sufficient operating cash flows to more than cover its interest payments and I have no concerns about LMT’s capital structure.
Return on Invested Capital
The following chart shows the history of LMT’s return on invested capital (ROIC):
Author’s compilation using data from Lockheed Martin’s 10-K filings.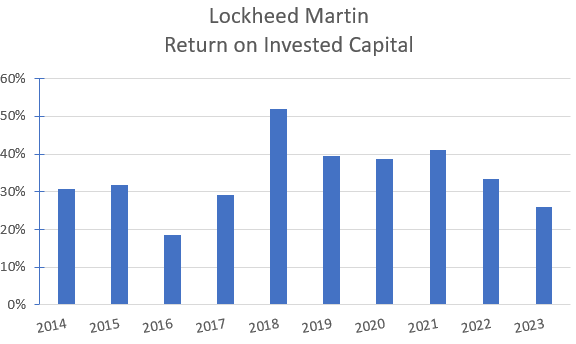
The aerospace & defense sector’s median ROIC is 6.2% and LMT currently ranks in the sector’s highest decile.
Although LMT’s ROIC is excellent, it is evident that the metric has been declining over the last 5 years. The peak ROIC occurred in FY2018 and coincided with LMT’s lowest level of invested capital and its highest level of unfunded pension liability.
LMT’s high ROIC is helped by its relatively low effective tax rate (generated by tax breaks for R & D and foreign intangible income) but I suspect the real driver is a function of how LMT’s reinvestment is funded.
LMT has a very low reinvestment / sales ratio (6.5% over the last 10 years) which indicates that the US government is probably funding a significant portion of the required reinvestment. The relatively low reinvestment is also a function of LMT’s low and stable revenue growth (higher growth requires a higher level of reinvestment).
The relatively high ROIC leads me to conclude LMT has quite a deep and sustainable competitive advantage relative to its competitors provided that the current government funding arrangements remain in place.
My Investment Thesis for Lockheed Martin
I would classify LMT as a mature company meaning that it would be difficult for the company to grow revenues above the underlying growth rate of the economy. Over the last 10 years LMT’s revenues have grown at a 4.1% compound annual growth rate whilst the US economy (as measured by gross domestic product) grew at 5% per year.
My scenario for LMT is:
Growth Story
There will be no revenue growth above the growth of the US economy for the foreseeable future. Although defense spending in many “allied” countries may increase it will not be material enough to move the dial for LMT.
Margin Story
LMT’s operating margins are already high relative to its sector competitors. Remember that I use an adjusted margin which is slightly higher than LMT’s reported margin. I expect that these margins can continue to slowly expand and will finish at around the sector’s 75th percentile.
This scenario generates a terminal operating margin of between 12% to 15% per year.
Reinvestment and Competitive Advantages
Because my scenario is based on LMT growing at the same rate as the economy there will be no requirement to invest for growth. LMT will need to reinvest at the rate required to maintain their long-term return on invested capital (a high ROIC requires a lower level of reinvestment).
I believe that LMT has a strong competitive position based on technological leadership in its chosen markets. LMT has shown that it has the ability to develop innovative product systems and my scenario assumes that this will continue.
I am forecasting a long-term ROIC of between 12.5% and 17.5%, which is in the sector’s highest quartile.
Risk Story
My scenario is based on the current global macro-economic conditions (interest rates are stabilizing and economic activity appears to be shallowing). As I have already indicated, LMT’s business is reasonably steady and does not cycle to any large degree. This leads to a relatively low level of volatility which in turn influences LMT’s cost of capital.
In my opinion the major risk to LMT’s existing business is associated with the ongoing demand (both by the US and its allies) for the F-35 program. This platform currently represents 26% of current revenues and the near-term continuity of orders is extremely important to LMT’s valuation.
LMT’s capital structure is influential on its long-term cost of capital. I am not expecting any significant changes to LMT’s debt ratio, and it will continue to follow the sector’s level of gearing.
I estimate that LMT’s current cost of capital is similar to my estimate for the current median of all US-listed companies. My scenario has a long-term cost of capital between 7.75% and 8.25%.
Valuation Assumptions
The following table summarizes the key inputs into the valuation:
Author’s valuation model key inputs.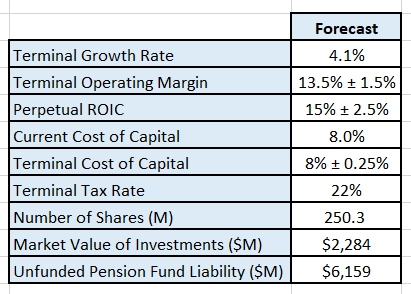
There are other implicit assumptions within my valuation which should be noted:
- I have converted LMT’s equity investment in United Launch Alliance into a market value by multiplying the current book value by the sector’s median price to book ratio (2.43).
- I have assumed that LMT’s effective tax rate will over time move to the US marginal rate.
- I have subtracted the current value of LMT’s unfunded pension liability from my estimate of LMT’s equity value.
Discounted Cash Flow Valuation
The valuation has been performed in $USD:
Author’s valuation model output. Author’s valuation model output.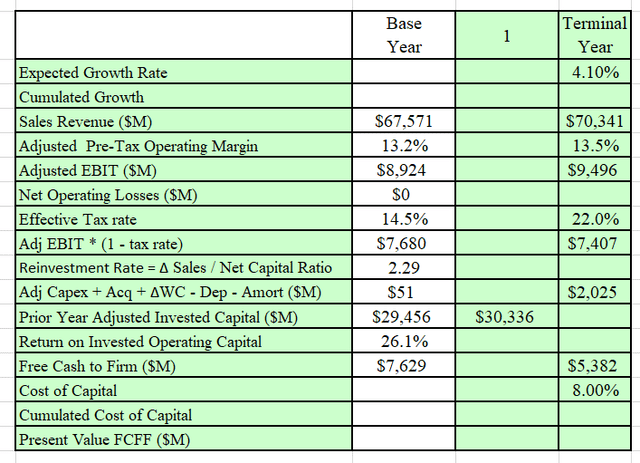
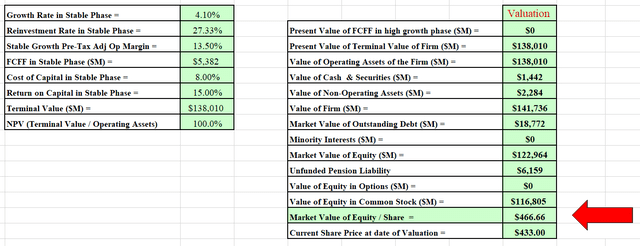
The model estimates that LMT’s Equity Value is $116,805 M.
This equates to a mid-point value per share of $467.
I also developed a Monte Carlo simulation for the valuation based on the range of inputs for the valuation. The output of the simulation is developed after 100,000 iterations.
The Monte Carlo simulation can be used to help us to understand the major sources of sensitivity in the valuation.
Author’s valuation model Monte Carlo simulation output.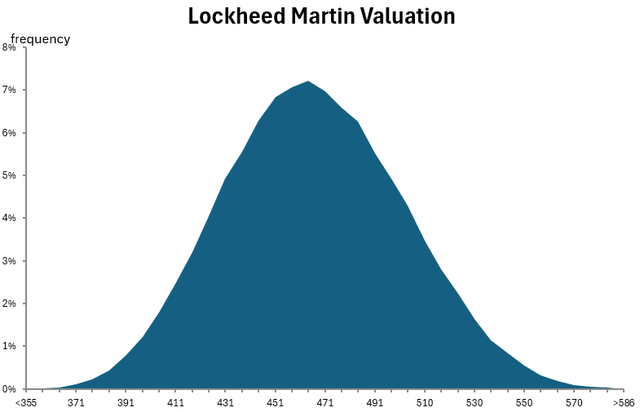
The simulation indicates that the valuation is very sensitive to the long-term operating margin, the terminal cost of capital and the terminal ROIC.
I estimate that LMT’s intrinsic value is between $355 and $586 per share.
This would indicate that LMT is currently cheap relative to its intrinsic value.
Final Recommendation
My analysis indicates that when using reasonably conservative inputs, LMT is currently priced below its intrinsic value.
It is interesting to look at the long-term returns from an investment in LMT relative to the broader market and its sector:
Author’s compilation using historical pricing data from Yahoo Finance.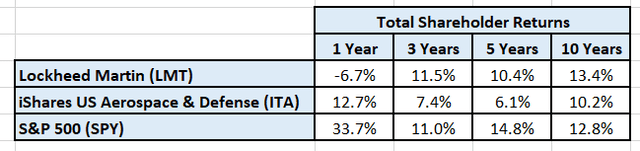
The table indicates that during the last year LMT has significantly under-performed both its sector and the broader market. Over the longer term LMT has essentially performed in-line with the market but significantly better than its sector.
When does LMT under-perform the market?
When the broader market enters a “risk-on” period then LMT tends to under-perform. This can be seen by looking at the following chart which compares LMT against the SPY:
Author’s compilation using TradingView.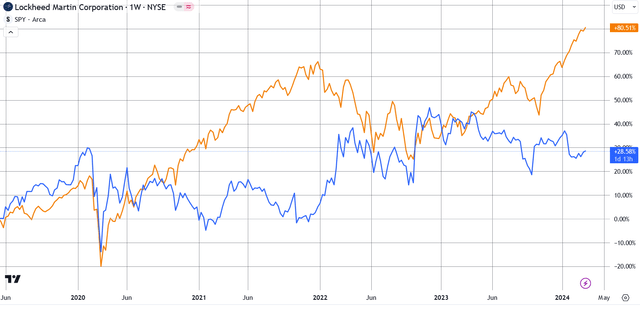
The chart shows that when the broader market starts to accelerate to the upside (the orange colored line), LMT tends to get “stuck in the mud” (the blue colored line). However, when risk comes “off”, LMT out-performs the broader market.
This relationship should not be forgotten by LMT investors.
What should existing shareholders be doing?
Holders of LMT have suffered through the stock’s under-performance over the last 6 months. I’m not a technical analyst but my reading of the LMT chart indicates that the price may have bottomed out and appears now to have started on an upward trend. I think that there is a reasonable probability that the price may soon move above its 50- and 90-day moving averages. This indicates to me that LMT appears to have upward momentum.
Existing holders should review their allocation to the stock and make sure that their holding is in-line with their investment plan.
On the basis that I believe that the stock is underpriced, and the price action has upward momentum my call is that LMT is a BUY.
I recommend that investors always have a view on each stock’s underlying value and the stock’s current price momentum before making any investment decisions. With every stock, have a specific investment plan, going in with your eyes wide open about when to buy, hold and sell.
Credit: Source link