

courtneyk
Investment Thesis
MSCI (NYSE:MSCI) is fast draining its cash under a high debt load and has its total equity fallen into the negatives. The company has shown strong ongoing financing needs that have limited room to grow in the next five years. The ESG controversies that could impact its bottom line aren’t about whether ESG is a valid investment factor overall but are rooted in the company’s own calculation and data provision that have been accurately reflecting the true ESG effects. We consider the current price too high and see more room to decline. We recommend a sell for now.
Company Overview
MSCI, founded in 1968 with headquarters in New York City, is a global provider of investment decision support tools, data, and analytics. The company has reportable segments such as Index, Analytics, ESG & Climate, and All Other Private Assets. Its products and services include Indexes, Portfolio construction and risk management tools, ESG and Climate Solutions, and Real estate market and transaction data and analysis.
Strength
MSCI is synonymous with index investing in the financial market. The company connects every part of the investment cycle with the investors/product buyer, product broker/seller, and intermediaries.
MSCI: Support Investment Cycle (Company Presentation)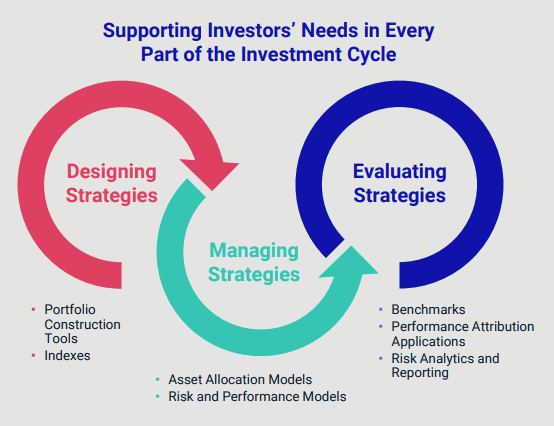
MSCI has a production process of using vendor-provided data to construct indexes and then supply the final products through proprietary applications to end users, along with other related services they provide to enhance the usage of the products. It has over 950 data contributors from the buy-side and sell-side, plus the vendors and brokers in between, spreading to 2000 clients in 170 countries. It definitely has the scale in coverage and aggregate growth in all corners of finance.
MSCI: Ability to handle Client workflow (Company presentation)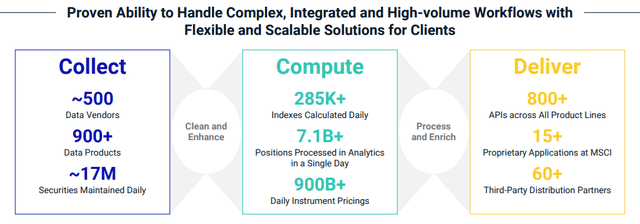
The company positions itself to be well suited for the nature of the market – providing service in an all-weather manner in both the ups and downs of the investment cycle.
MSCI: Strength vs Stress (Company Presentation)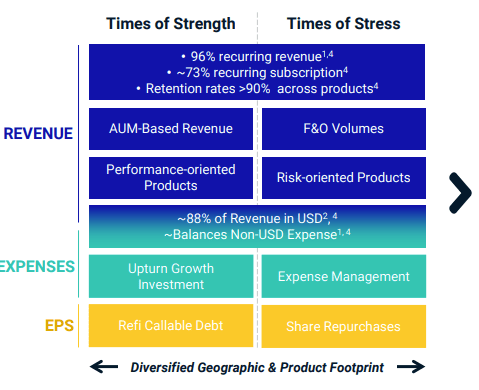
With one of the largest databases and products covering every corner of the financial market, MSCI extensively utilizes software to weave the data and models to help investors make sense of the market and perform investment research.
MSCI: Wheel of Sustainability (Company Presentation)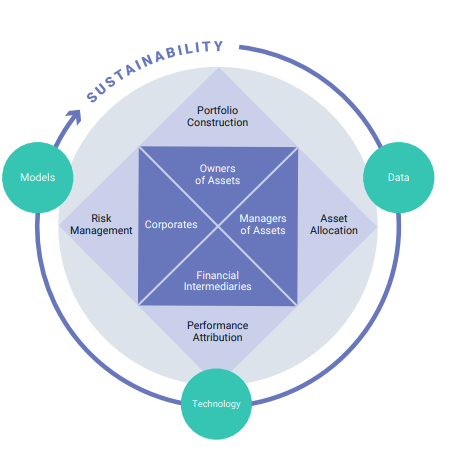
By doing so, MSCI has been able to greatly flatten the growth curve of its costs. The extraordinary journey of costs and expense control at MSCI in the past fifteen years resulted in stable yet high margins. Compared to the pre-’08 era, its total cost of revenue and operating expenses as a portion of its revenue have been cut down by almost half. Its revenue was able to continue climbing without inflating its costs.
MSCI: Quarterly Costs and Expenses (Calculated and Charted by Waterside Insight with data from company)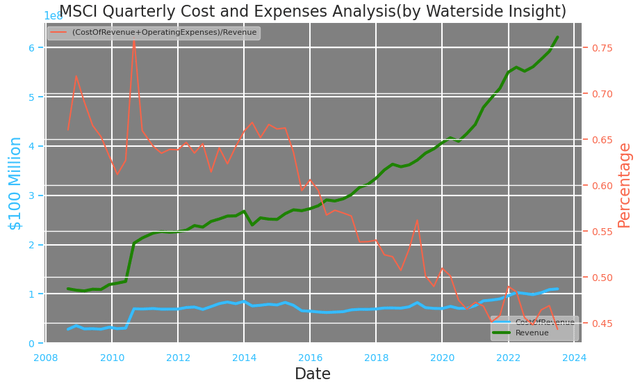
MSCI’s revenue growth by segment in the past few quarters has been gradual and stable. The total revenue struck a 12.57% YoY growth in Q2, which is consistent with its average revenue annual growth rate of the mid-teen of the past ten years.
MSCI: Revenue By Segment (Charted by Waterside Insight with data from company)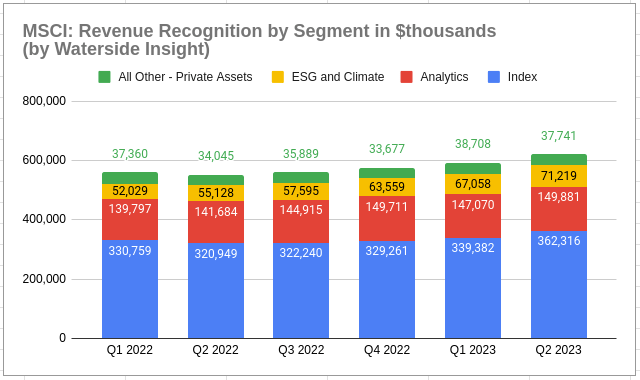
The heatmap of the quarterly growth rate of each segment shows that the largest segment, Index, swung with an acceleration of speed from a loss of 3% to a gain of 6.7% in the past year and a half. And the second largest segment Analytics fluctuates from gain to loss. While ESG & Climate has consistently grown in the mid-single digit to low teens. It is impressive but that is overall less than 1% contribution to the total quarterly revenue growth. As for the smallest segment, Private Assets posted volatile gains and losses. This heatmap reveals the growth engine still rests on the largest segment, Index, which contributes around 2% to the total quarterly revenue growth. Although its ESG&Climate segment is healthy and robust but cannot provide substantial growth for the revenue yet, it is the fastest growing segment.
MSCI: Growth Rate by Segment (Calculated and Charted by Waterside Insight with data from company)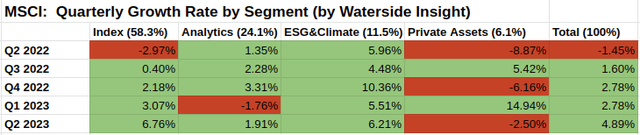
Its ESG segment’s growth reflects the journey ESG investing has taken, from nascent to full-fledged, yet the controversies hanging on it are far from being over.
MSCI: ESG Run Rate (Company Presentation)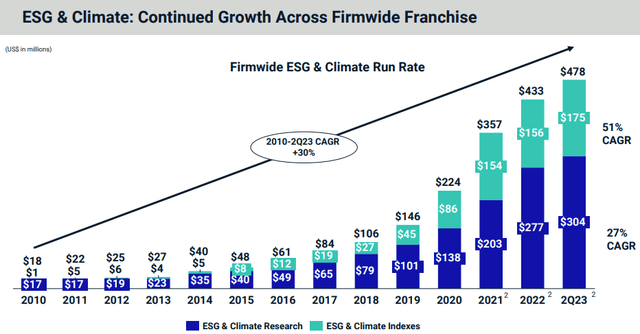
There has been a debate and pushback towards ESG investing in the past two years. We think it may not be such a bad thing. There have been a lot of speculative products with questionable selections that resulted in waves of “greenwash”. MSCI’s response in its 10K was that ESG is still important and will not go away. We think this is misplaced. When this debate comes down to the level related to MSCI, the question is not whether ESG is a valid factor in investing decisions, but whether MSCI has provided accurate and sufficient data and methodology in assessing the effectiveness of reaching the ESG goals. SEC has mounted MSCI and S&P as targets in its investigation of “greenwash”, while MSCI itself has downgraded or stripped off triple-A ratings of a wide range of products related to its ESG ratings since 2021.
So to be clear, we think pushing back “greenwash” does not equal pushing back ESG investing but looking for higher accountability of the investment products. In other words, how many assets and products based on MSCI ratings have been classified as “greenwash” and have been stripped of triple-A ratings? And how will MSCI address this problem going forward? There hasn’t been any detailed report from MSCI on this so far. It did, however, publish a short report in August updating its methodology and the controversies surrounding it. Is this enough? We don’t think so. SEC just published a new rule for cracking down “greenwash” about a week ago and this is far from over. Does it mean MSCI needs to update its rule book again?
Certainly, there is a lack of cross-industry approach to how to rate ESG products. Such pushback reflects that void. And there are other aspects of the pushback that involve a lot of politics. Overall, from an investors’ point of view, this raises the standard for investment managers to provide convincing results and products to align with the goal of improving Environmental, Social, and Governance. In any case, ESG is not going to and should not go away, but instead, it is an opportunity for MSCI to provide better info, data, and a platform for investment professionals to dissect and select from. However, it may not be able to do it with high profitability if it is taking full accountability. In our opinion, this whole controversy begs a deeper question of whether ESG investing products can be massively produced and standardized when a lot of underlying data themselves are at a granular level without clear international standards and subject to fast changes. (Think the newest trend currently is adding big floods as the next target). In other words, is MSCI’s goal of approaching ESG investing passively at scale valid on its own? Of course, this will be a different debate that we won’t delve into here.
Weakness/Risks
Both rising debt load and stagnant asset growth have caused MSCI’s total equity to drop deep into the negative. The largest decline in its total assets in Q2 actually came from the decrease in cash and cash equivalent, which we will delve into soon.
MSCI: Total Equity (Calculated and Charted by Waterside Insight with data from company)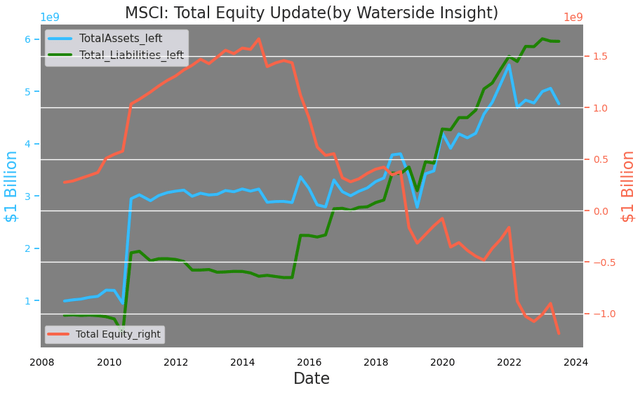
Behind the heavy borrowing, we see periods that when MSCI pauses growing its debt or even cutting it back, its EBITDA would be stagnant, such as from 2010 to 2015, and briefly before 2020.
MSCI: Debt Effectiveness (Calculated and Charted by Waterside Insight with data from company)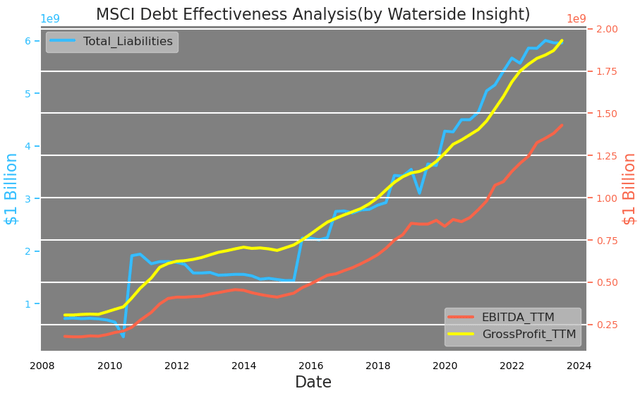
In its 2023 guidance and revision, the only thing that has changed since early this year is higher CapEx. In fact, this extends a rising trend in CapEx for about a year and a half now to almost doubling. While in the past, it mainly oscillated within a year cycle. The company explained that it spends it on software upgrades, including internally developed software projects. It can be seen that “internally developed software projects” were mentioned eight times in its Q2 10-Q, up from three times in Q1. According to its presentation, the tech-related efficiency growth is mostly in Cloud Migration, Streamline technology development, and Data process improvement. This will pressure its free cash flow going forward.
MSCI: TTM Operating Cash Flow vs Free Cash flow (Calculated and Charted by Waterside Insight with data from company)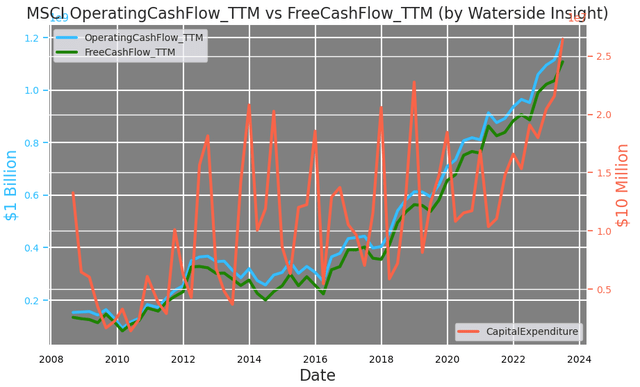
It also stood out to us how much and how fast MSCI is draining its cash. Its cash-at-end-of-period has taken consecutive blunt falls since the end of 2021. By now, it is at par with where it was around ’08, which has undone the accumulation since then. The company stated that
MSCI typically seeks to maintain minimum cash balances globally of approximately $225.0 million to $275.0 million for general operating purposes
We expect it will not go below where it is currently.
MSCI: Cash-at-hand (Calculated and Charted by Waterside Insight with data from company)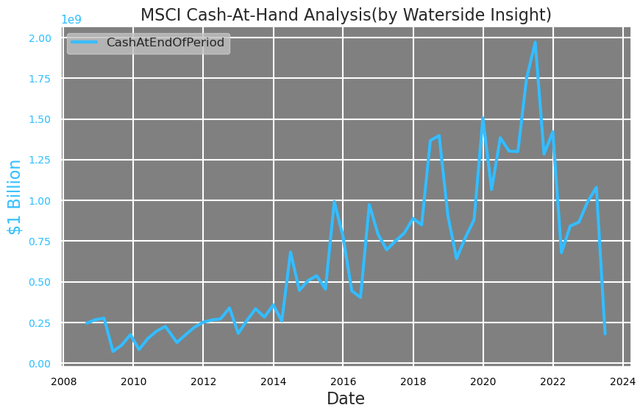
According to its 10-Q, it mostly uses cash for the following:
We intend to use these sources of liquidity to, among other things, service our existing and future debt obligations, fund our working capital requirements for capital expenditures, investments, acquisitions and dividend payments, and make repurchases of our common stock.
MSCI’s shareholder return has been stable and regular in proportion with respect to its operating cash flow in the past seven years.
MSCI: Quarterly Shareholder Return (Calculated and Charted by Waterside Insight with data from company)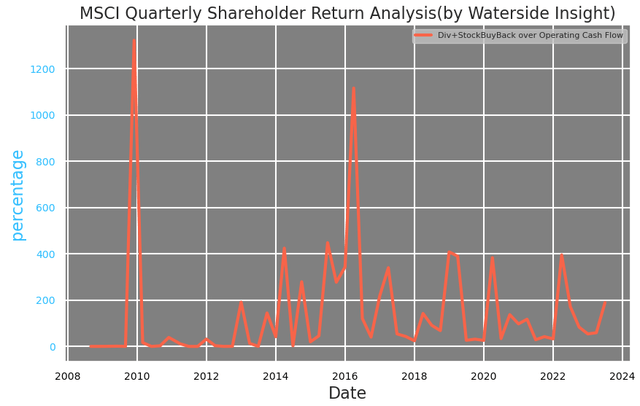
It looks like the most substantial spending of MSCI’s liquidity is on debt repayment. It spent $1.14 billion in 2020 and again $1.05 billion in 2021, respectively. No doubt some of the liquid was draining from its cash and cash equivalent. Currently, this repayment amount has lessened. It has been paying $2.19 million per quarter in the past few quarters.
MSCI: Debt Repayments (Calculated and Charted by Waterside Insight with data from company)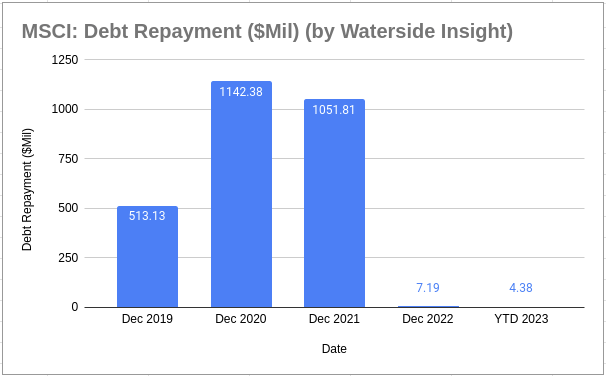
From its debt maturity profile, the total repayment for this year will be around $8.4 million. It seems it can maintain the repayment around or double of current level in the next three years, while the next maturity comes in 2027.
MSCI: Unsecured Debt Maturity Profile (Company Presentation)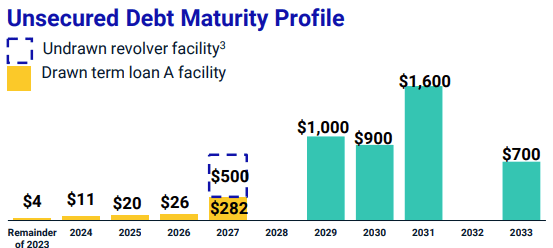
However, what to expect ten years down the road in the investing landscape is the tight condition of our entitlement payout among all the states. Institutional investors such as pension funds will not be content with their current index-matching investment practice because their funding ratios are mostly below what is required, so they will need to actively seek higher returns instead of at par with market-return strategies. Will passive index investing be as popular as they are now with institutional investors, we do not know. MSCI will probably need to come up with more diversified products to help their clients to seek alpha. Institutional investors can come here to read our articles on Seeking Alpha, or participating in more differentiable private equity investment vehicles, or other active management products that produce higher alpha. But the private equity products segment at MSCI happens to grow at a volatile rate and is relatively small currently, as we alluded to earlier. Overall, we think the road to higher profitability will be harder, not easier, for MSCI ten years from now. Certainly, the company can refinance its debt before the maturity, most likely in the next five to seven years, or the next rate cut cycle.
MSCI: Top 50 state Public Pension Funds Funded Ratios (Global SWF Data Platform)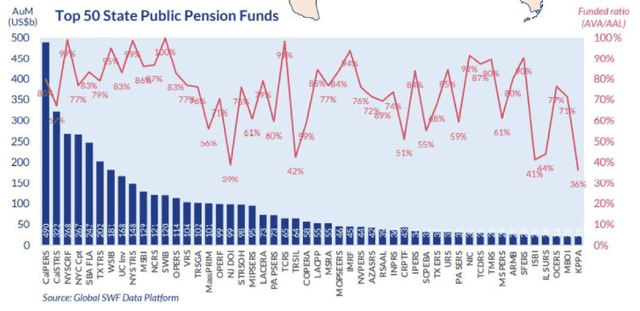
MSCI continues to have sprouting financing needs. While its operating cash flow growing gradually, its investing cash flow is minuscule in comparison, its financing cash flow has been substantial in the past three years.
MSCI: Net Cash Flow Breakdown (Calculated and Charted by Waterside Insight with data from company)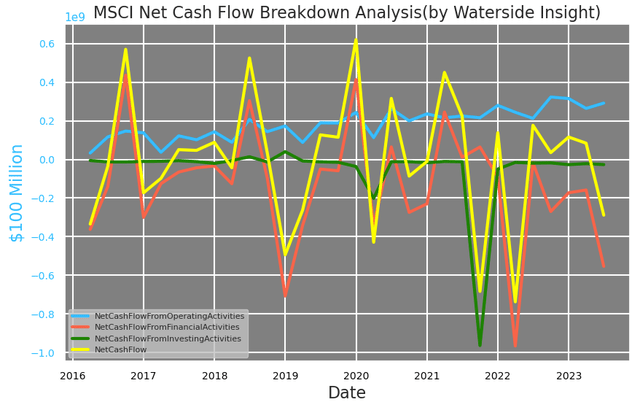
The question we have in mind is given its continuous borrowing needs, which maturity spectrum can it expand its debt? The ten-year horizon is full with over $3.5 billion maturity. So the logical guess will be the three to five-year maturity spectrum. Given the current interest rate environment, that will be much more costly than before. And given its low cash-on-hand, it will be unwise to take on short-term debt. Its current cash-to-debt ratio is more than 5x.
MSCI: Cash and Debt (Company Presentation)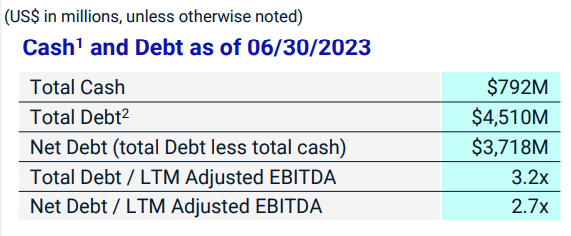
We think MSCI’s borrowing capacity is highly constrained, which could, in turn, impact its earnings, given the correlation between the two as we alluded to earlier.
Financial Overview
MSCI: Financial Overview (Calculated and Charted by Waterside Insight with data from company)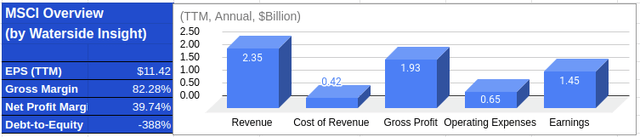
Valuation
By combining all our analysis above, we use our proprietary models to assess MSCI’s fair values with a ten-year projection ahead. We assume a cost of equity of 6.85% and a WACC of 7.18%. In our base scenario, the company has a normal growth rate for the next three years but cash flow constraints show up after that, which introduces more volatility later on; it is priced at $450.23. In the bullish case, the company fares better in the near term but still has a similar trajectory after the first 3-4 years, it is priced at $487.27. In our bearish case, it differentiated still in the near term, which due to higher interest rates and borrowing constraints, it has single-digit growth instead, it is priced at $434.63. The current market price is overvaluing the stock, we believe.
MSCI: Fair Value (Calculated and Charted by Waterside Insight with data from company)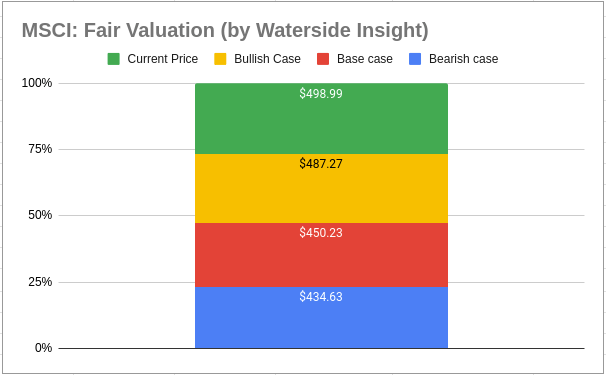
Conclusion
As a respectable brand in the investing world, MSCI means benchmark and the financial universe. However, its financial leverage has reached a level too high that the company will eventually need to reconcile with, even with a stable credit rating currently. Its ongoing borrowing needs and heavy debt load cannot be overlooked by an all-encompassing financial product portfolio. And the fastest growing segment of its revenue in ESG has more questions than answers at a product level (not ideology level). We think it is overvalued at the current price and recommend a sell.
Credit: Source link