

Sometimes it feels like getting through a maze trying to find new investment opportunities Floresco Productions
Just when it seems like the market is going to head lower it took off in the other direction and it didn’t take long over the last 20 days to show some pretty compelling growth in the big three indexes.
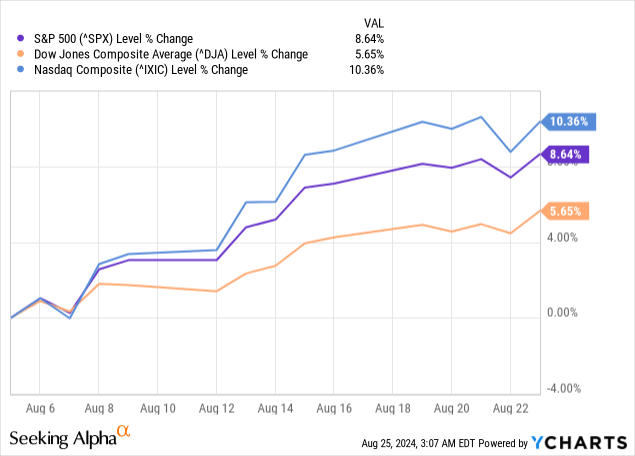
This has made it even more difficult to talk about undervalued (existing or new) stocks that might be worth further investigation.
The goal of these articles is to point out investment opportunities that look appealing, and also gather feedback from others about investments that I may have potentially overlooked. The series will be focused on gathering enough information to understand whether or not a potential investment is worth taking a deeper dive into. The challenge associated with finding value is that it often includes companies that are significantly more risky because it can be difficult to differentiate between an investment that is undervalued and one that is in free fall.
Lincoln Electric (LECO)
LECO has long been known for providing some of the highest quality welding equipment available with its main competition coming from the Miller (ITW) and ESAB (ESAB) brands. Basically, at the end of the day you can say that all three companies are known for providing exceptional welding equipment. Something the companies all have in common is providing compelling returns for shareholders.
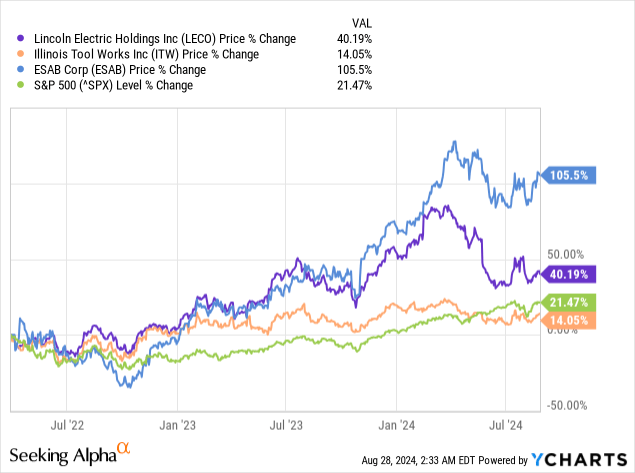
Using the starting date for when ESAB began trading on its own we can see that only ITW has not provided the same level of return even though LECO’s stock price has been cut back drastically. During Q1/Q2 2024 we saw investor sentiment reach peak optimism and the share price since then has dropped nearly 25%
My reason for focusing on LECO is that ESAB is still too new and the share price has increased 105% in a very short period of time. The track record of dividend payments and increases isn’t well-established enough at this point in time (stock price volatility with no dividend is not something I am particularly fond of).
John and Jane (and myself) have owned ITW in the past but we opted to sell our positions when it appeared that there really aren’t any strong catalysts to benefit the stock price and I even see concerns that lead me to believe the stock is headed lower. LECO and ITW share comparable payout ratios but LECO’s recent increase dividend history is outpacing that of ITW’s.
LECO:
- 3 YR Average Dividend Growth – 11.10%
- 5 YR Average Dividend Growth – 9.00%
- 10 YR Average Dividend Growth – 12.02%
ITW:
- 3 YR Average Dividend Growth – 7.09
- 5 YR Average Dividend Growth – 6.96
- 10 YR Average Dividend Growth – 12.79%
When we factor in that both companies have comparable payout ratios it tells me that the runway for growth revenue and dividend growth is substantially longer.
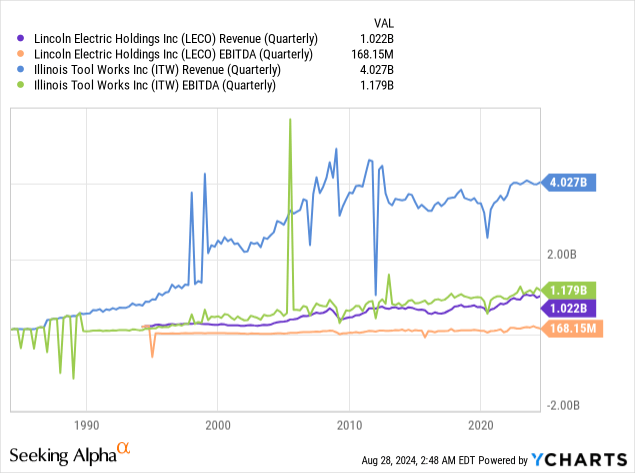
ITW is also a massive entity with revenues that are approximately four times greater than LECO’s and possesses an EBITDA that is about the same as the revenue produced by LECO. With ITW it can be more difficult to move the ship when you are the 800 lb. gorilla in the room. Small acquisitions for LECO can have a much larger impact over the long-term, meanwhile, ITW has seen revenue remain stagnant for over 15 years.
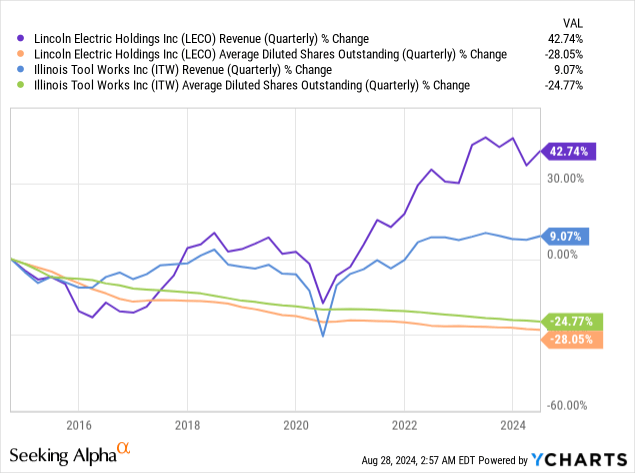
LECO has demonstrated over the last five years in particular that it has a strategy and size that has allowed it to grow revenues four times faster than ITW. At the same time we have seen both companies put a tremendous amount of resources towards share repurchases, thus reducing the total share count outstanding.
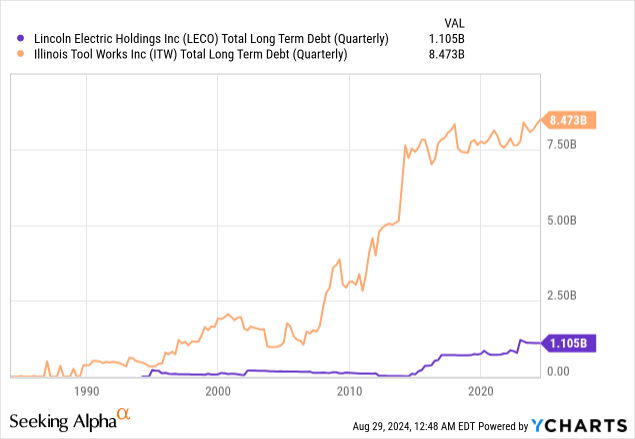
What I think would be most frustrating to shareholders of ITW is just how much debt the company has incurred since 2010 when revenues first flatlined. The total long-term debt levels have more than tripled for ITW since 2010 and now represents about 50% of annual revenue while LECO’s debt levels are closer to 25% of annual revenues.
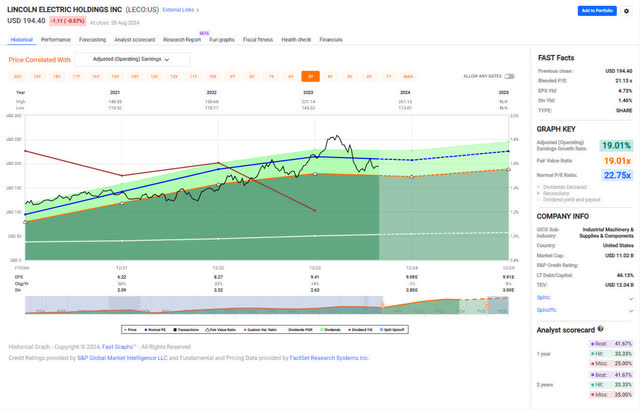
Normally when I use Fast Graphs I look at the 10-year history but I wanted to include the 5-year history as well because of the substantial revenue growth as demonstrated during this time. The 10-year chart suggests that its fairly valued while the 5-year chart suggests that is undervalued if we believe that the company can maintain its current earnings and revenue growth trajectory.
LECO – FastGraphs – 10-Year (FastGraphs) LECO – FastGraphs – 5-Year (Fast Graphs)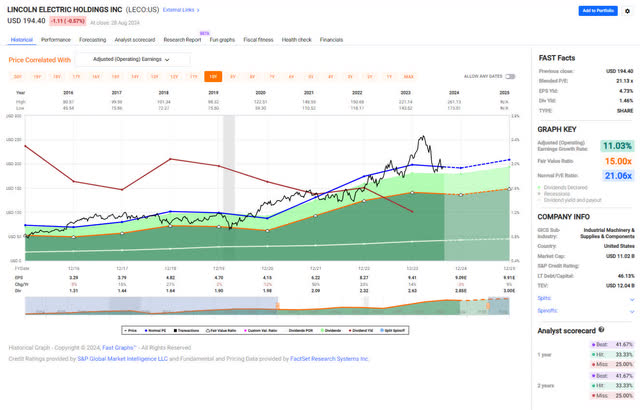
Overall I think there is a clear picture that LECO presents a much more compelling long-term value when compared with ITW. ITW does offer a more compelling dividend yield, but this is normal for a company that has been around as long as it has. What doesn’t seem normal with ITW has been its use of debt to product stagnant revenues over the last decade and this suggests that LECO is more prudent about allocating its resources since it has demonstrated both earnings and revenue growth while assuming a higher debt load.
Stanley Black and Decker (SWK)
Let me start by saying that I am personally have Milwaukee Tools (OTCQX:TTNDY) and have established a tool setup that includes foam Packout inserts cut out for each individual tool for both the 12V and 18V lines of tools. I am a tool fanatic having rebuilt an entire home I have come to understand the value of owning high-quality tools that don’t fail when you need the most. With that said, I am not a tool purist in the sense that I won’t own a DeWalt tool (which is a brand in SWK’s lineup) because I think both companies make amazing tools but it just so happens Milwaukee won me over based on my needs.
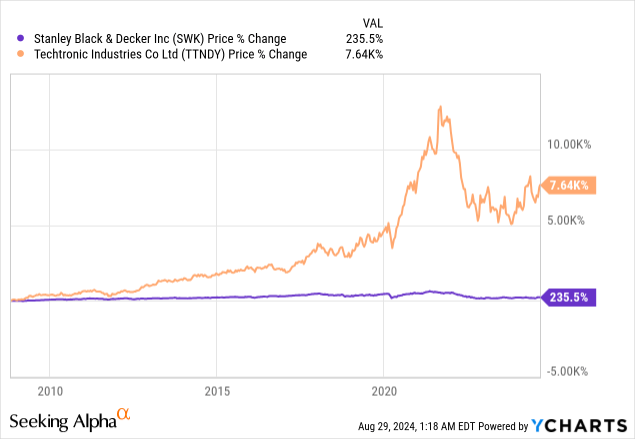
When it comes to stock price performance, its a no-brainer that TTNDY beats out SWK. Even when we start with a date prior to the pandemic we can see that SWK’s current price today is -23% below pre-pandemic levels.
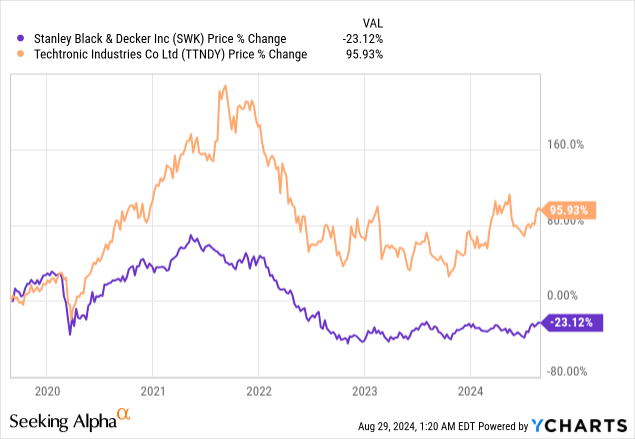
Taking an even longer term perspective, TTNDY since becoming publicly traded has absolutely wrecked SWK in terms of stock price performance.
But the good news is that the value proposition offered by SWK appears to have a strong bottom in which means that it could be a great investment opportunity to collect an above-average yield (compared to historical figures) and also benefit from capital appreciation.
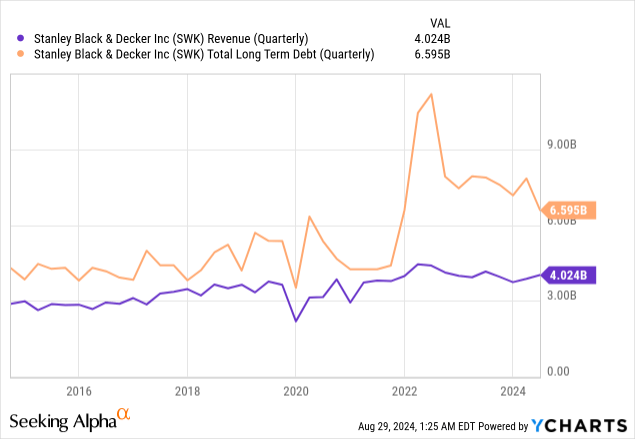
The chart above shows that debt levels appear to be moderating after it made the decision to purchase the remaining ownership of MTD Holdings for $1.6 billion along with Excel Industries for another $375 million. This contributed to a substantial increase in the company’s debt load even though revenue has remained stagnant during this time.
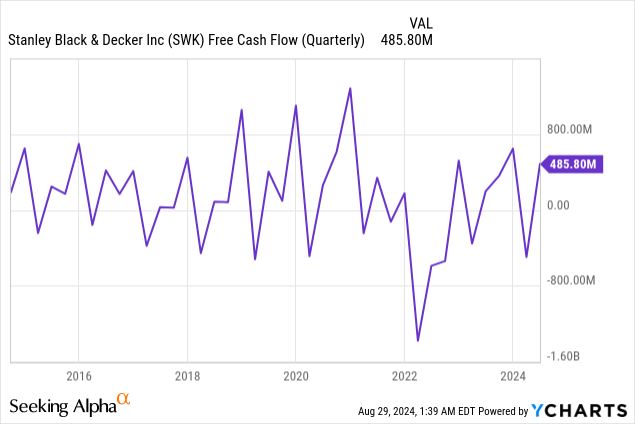
The good news is that since December 2023 we have seen the debt load paid down by roughly $1 billion. This suggests that free cash flow is moderating after its abysmal performance following the acquisitions.
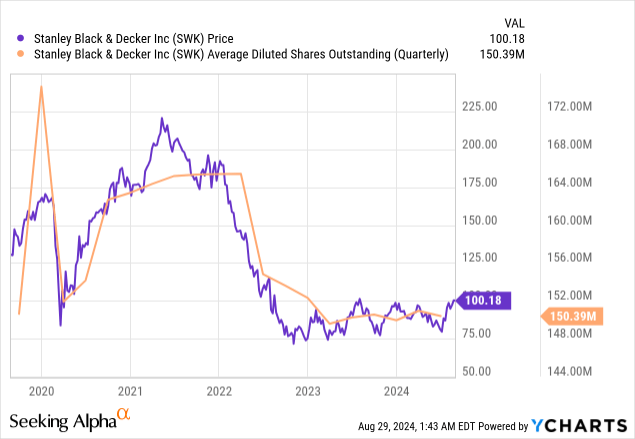
SWK had to make some tough decisions which can be seen in the employee headcount that started January 2022 with 71,300 employees and ended December 2022 with 54,200 employees. Reduction of debt load has not come at the expense of selling additional shares to help pay down the debt faster (this would be especially troublesome since investors in SWK wouldn’t want to see management issuing shares at half the price they were traded at only a few years ago).
The goal is to have saved $1.5 billion cumulatively by the end of 2024 and $2.0 billion by 2025. At the same time, the company believes this will allow the investment necessary to achieve 35% adjusted gross margins which it has clearly made progress towards.
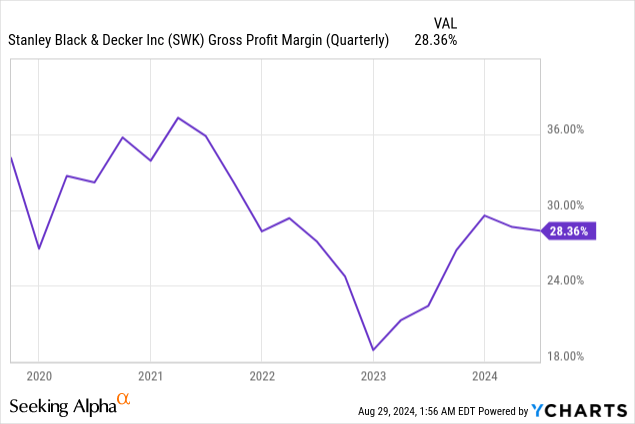
With the moderation of debt levels, improving margins, and stabilizing cash-flow I believe that this represents a great entry point for a company that has traditionally offered a much less compelling dividend yield with a 58-year history of consistently paying out increased dividends. Dividend safety currently looks abysmal from the issues of the last two years (this resulted a payout ratio well-over 100%) but during the last earnings call we got an update on adjusted earnings increasing from $3.50/share to $3.70/share while the high end of guidance remains at $4.50/share. Prior to these challenges, SWK was able to maintain a payout ratio near 40% but even if the company comes in at the high-end of earnings the annual dividend of $3.28/$4.50 = 72.9% payout ratio (which is still considered high for an industrial behemoth like SWK).
So what does this mean for investors?
Don’t expect the dividend growth the resume in a meaningful way anytime soon but any concerns regarding potential dividend cuts should continue to diminish with time as long as SWK continues to execute like they have over the last few quarters.
With earnings per share estimates looking strong going into 2025 and 2026 this should continue to reduce the payout ratio further:
- Est FY-2025 – $3.30 Dividend / $5.60 Earnings = 59% Payout
- Est FY-2026 – $3.34 Dividend / $6.66 Earnings = 50.1% Payout
Similar to the discussion about LECO, I utilized the five and ten year FastGraphs because 10 years suggest its overvalued but the five year makes more sense because of the trajectory of the company’s earnings and FCF improvements.
SWK – FastGraphs – 10-Year (FastGraphs)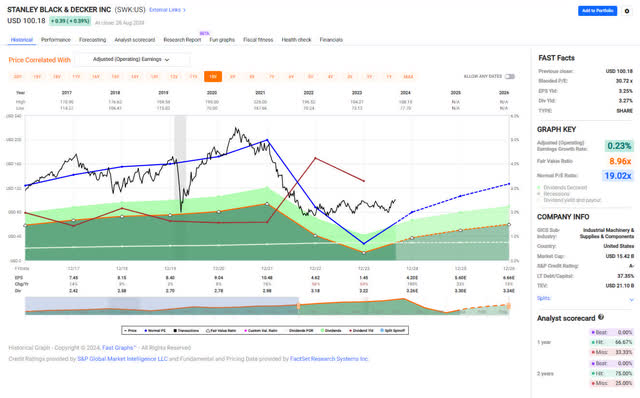
This entire thesis is built around the idea that SWK is a solid company that went through a transitional period and that enough time in the transitional period has passed to give prospective investors the confidence that they need to know that everything is getting back on track.
Even if we use a conservative Price/OCF (Operational Cash Flow) over the last 10 years we come up with a share price that is 19.40x (this is conservative because it includes the time period where OCF was negative). OCF is expected to end 2024 with a total of $7.96/share resulting in an estimated share price of $152.19/share at a 19.40x multiple.
SWK – FastGraphs – OCF (FastGraphs)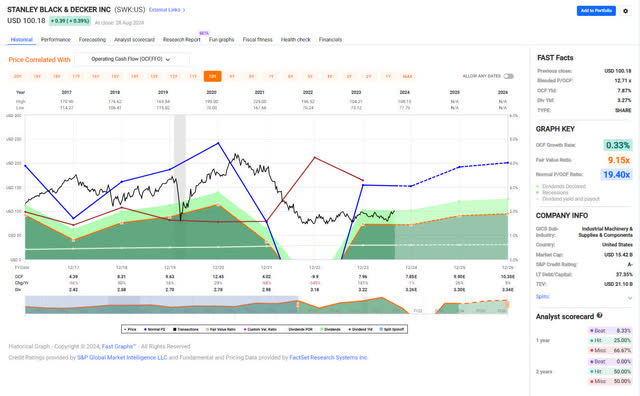
Conclusion
Both of these companies are brand new on my radar and I think that they both represent very different value propositions.
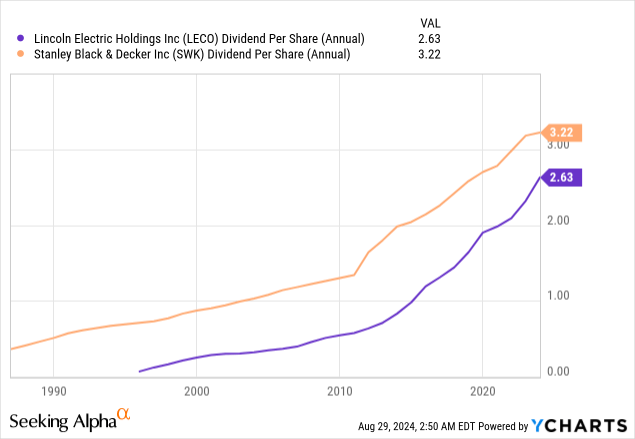
LECO represents the rapidly growing company with favorable metrics including revenue growth and has demonstrated it is very shareholder friendly by allocating funds to buyback shares and pay investors a consistently growing dividend of 12.2% annually over the last 10 years. LECO has consistently increased dividends for 29 years straight.
SWK represents a stable company that has completed the toughest phase of its transformation and now represent an undervalued stock that is offering a yield that has not been available historically. Although dividend growth will likely continue to be minimal the attraction of capital appreciation through moderation of debt and increased FCF makes this company a compelling buy at a time when it is difficult to find quality dividend-paying stocks at a reasonable price. SWK has successfully maintained its annual dividend growth streak of 58 years even through this challenging period.
The risk factors for these companies are very different and this article is intended to be an introduction to the companies and not exhaustive of everything you need to know to make an investment. I believe that both stocks are the kind of investments I would be interested in holding in my portfolio (or John & Jane’s accounts for whom I help manage their investments). You can find the most recent article for the John and Jane series here.
What other opportunities do you see in dividend-paying companies that are currently being offered at a discount? I would love to make this a regular series as I look for more ideas to rotate capital from stocks that have maximized their value (presenting little upside potential) to undervalued opportunities that present significant upside potential.
Credit: Source link