

natasaadzic
MO stock: cigarette volume and dividend yield
I last wrote on Altria Group, Inc. (NYSE:MO) three months ago. The article was titled “Can’t Argue With Its 10% Dividend Yield” and was published by Seeking Alpha on April 17, 2024, as seen in the screenshot below. In that article, as the title suggested, I focused on its dividend yields. More specifically, I argued that:
Altria Group currently has a dividend yield of 9.55%, which is above its historical average and among the highest levels in a decade. Its valuation ratios (e.g., P/E and P/cash) also indicate extraordinary discounts. Usually, these signs point to unsustainable dividends and/or terminally ill business fundamentally. But our conclusion is that neither scenario is likely and thus we consider the stock a good contrarian investment opportunity.
Seeking Alpha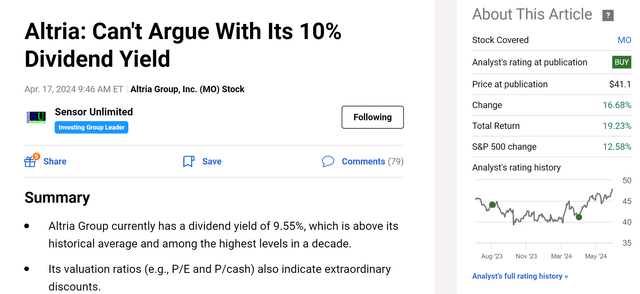
As a textbook example of a dividend growth stock, many other authors – both bulls and bears – have also examined the dividend perspective of MO. Thus, in this article, I want to closely scrutinize two common arguments widely made – one by the bulls and one by the bears – and argue why they could be misleading or at least partial. The first common argument is from the bears, who argued that the secularly declining cigarette volume would limit its future growth rates. The second common argument is often made by the bulls, who argue the high yield already provided enough downside protection.
In the next two sections, I will examine both arguments and explain why I think the first one exaggerated the risks and the second one understated the upside potential.
MO stock: declining cigarette volume is only half of the equation
There is no doubt that the demand for smokable products has been and is still declining. As illustrated by the chart below, which shows a 20-year study of the per capita sales of cigarettes, unit sales of cigarettes (in billions of sticks) have declined by almost a half over the past 20 years (from over 420 billion to about 220 billion). Also note that the data was published by CDC.gov, a source that I fully trust. Therefore, the bears’ concern over the shipping volume is totally valid, given the substantial decline in demand and also MO’s heavy reliance on its traditional smokable products.
Source: CDC.gov data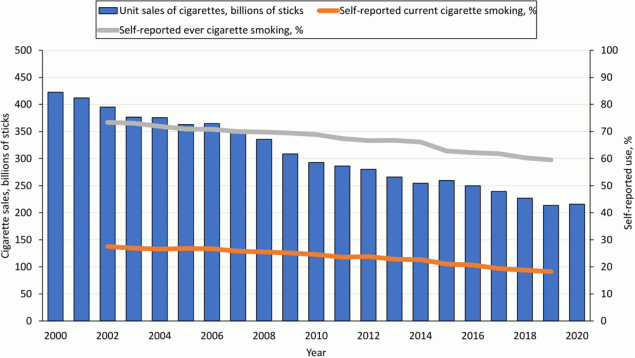
However, the declining cigarette volume is only half of the equation. The other half of the equation is the pricing and MO’s pricing power. The chart below shows the Consumer Price Index for tobacco and smoking products (average of all U.S. urban consumers). The index is measured on a scale where 100 represents the average prices in 1982-1984 (which shows you how much it has gone up since then). Over the last ten years alone, the index has climbed from about 900 to the current level of 1,541, translating into an increase of over 70%, far more than enough to offset the decline in shipping volume shown above.
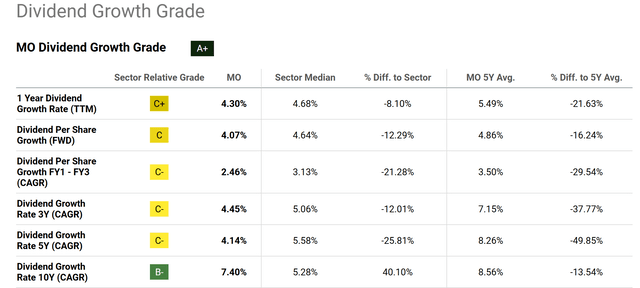
Specific to MO, thanks to its pricing power and new initiatives (more on this later), its profit has shown an overall upward trend despite the declining cigarette volume. As a dividend king, its dividend payouts provide a reliable measure of its economic income in the long term. Thus, its dividend increases provide a good measure of its true profit growth. As seen in the second chart below, the three-year CAGR (compound annual growth rate) for its dividend payout is 4.45%, the five-year CAGR is about 4.14%, and the ten-year CAGR is about 7.40%.
FRED Seeking Alpha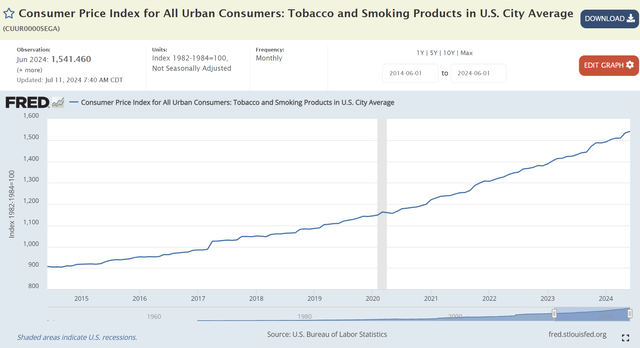
MO stock: high dividend yield underestimates its return potential
Now, let me examine one of the most common arguments made by the bulls. The argument came in different shapes, such as the current yield of 8%+ pays investors enough to wait for its new product development, or the yield is so much higher than average (see the next chart below) that the discount is enough to compensate for the downside risks, etc.
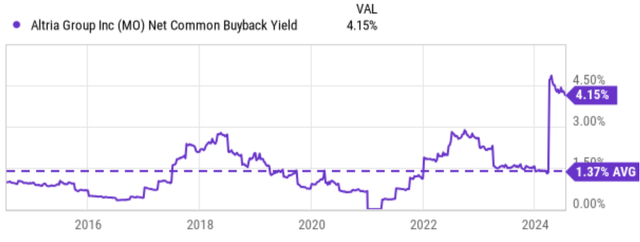
I fully agree with these arguments. And the point I want to make here is that they are incomplete in the sense that these arguments only considered the cash payouts. For long-term investors, what matters is the total shareholder yield – the sum of cash yield, net common buyback yield, and debt paydowns. MO has been returning capital to shareholders in all three ways, and the exclusion of the other two substantially underestimates its return potential.
Take share buybacks as an example. The chart below shows MO’s net common buyback yield in the past 10 years. As seen, its net common buyback yield is currently 4.15%, a substantial boost to the 8.18% cash yield. Historically, the average net common buyback yield is about 1.4%, also a substantial boost compared to the average cash payout yield of ~6%.
Seeking Alpha Seeking Alpha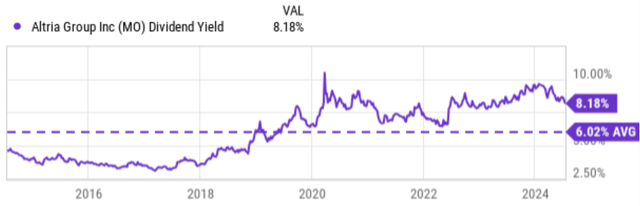
Other risks and final thoughts
The final upside risk I want to point out is the nature of compounding. Compounding is multiplicative rather than additive. Thus, the forces mentioned above (profit growth, high dividend yields, buybacks, etc.) are far more potent together than when considered separately. As an illustration of the potency of the combined forces, the projection below shows my calculation of the effects of share buybacks in the next 5 years. The projection was based on the following assumptions:
- I assumed MO to keep allocating about 30% of its operating cash (“OPC”) toward share repurchases, based on its historical capital allocation record.
- I assumed its OPC to grow at a CAGR of 2.6%, the same rate as its EPS growth projected by consensus estimates.
- I also assumed the P/OPC multiple to expand from the current level of 9.2x to 10x (which was its median multiple in the past 7 years). This is also the multiple that I assumed future share repurchases to occur.
Under these assumptions, you can see that despite the pessimistic OPC growth rate of 2.6% (translating into a total growth of 13.7% in 5 years), the OPC per share would grow by more than 33% thanks to the 14.8% reduction in share counts. And note that the 33% is far larger than the sum of 13.7% and 14.8% — illustrating the multiplicative nature of compounding.
You can certainly tweak my assumptions to explore different scenarios. However, I think the example here is sufficient to illustrate the potency of the compounding forces working in the MO’s favor. Other positive catalysts include its alternative/new products. Notably, the Oral Tobacco Products segment had solid showings in recent quarters. In the past few quarters, this segment’s revenues have been growing at a healthy pace thanks to both higher pricing and robust demand for on! Oral nicotine pouches.
Author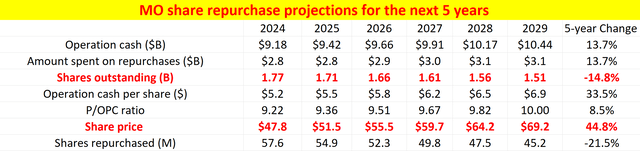
In terms of downside risks, again, the declining shipping volume of smokable products is definitely the elephant in the room. For example, in the first quarter, sales at the Smokable Products group declined by 3.6% YOY. Total cigarette volumes fell 10%, owing to significantly lower demand for Marlboro and other premium and discount brands. Higher promotional investments and elevated manufacturing costs (e.g., due to higher energy costs and higher labor costs) could also pressure profitability in the near term.
All told, despite these headwinds and the sizable price rally since my last coverage, I am still seeing a very skewed reward/risk profile for Altria Group, Inc. stock under current conditions and thus maintain my buy rating. In particular, this article closely examined two arguments often made about the stock: one from the bears (regarding the declining cigarette volume) and one from the bears (regarding the high dividend yield). I consider these arguments to be misleading or at least partial. They either exaggerated the risks or underestimated the return potential based on the analysis made in this article.
Credit: Source link