


doidam10/iStock via Getty Images
By Maya Beyhan
Sector-based approaches have historically shown they can be valuable for diversification, among other investor goals, but, until now, sustainability-inclined investors have been presented with limited options. With the recent creation of the S&P ESG Enhanced Sector Indices and the subsequent licensing of the Information Technology, Energy, Financials, and Health Care indices for a select range of ETFs in Europe, the potential for sector-based approaches to sustainable investing has increased significantly.
In assessing such potential, two questions are natural: first, what difference is there in sustainability profile for the ESG-enhanced sectors? Second, what difference is there in performance – particularly in the context of a multi-sector allocation? Intuition tells us what to expect: while performance differentials at the individual sector level might be expected to be diminished by diversification effects, we should expect sustainability improvements to be preserved.
Focusing attention on the individual sector indices, Exhibits 1 and 2 summarize their sustainability and performance characteristics as compared to their benchmark sectors, using the same analytical engine driving S&P DJI’s Climate & ESG Index Dashboard.
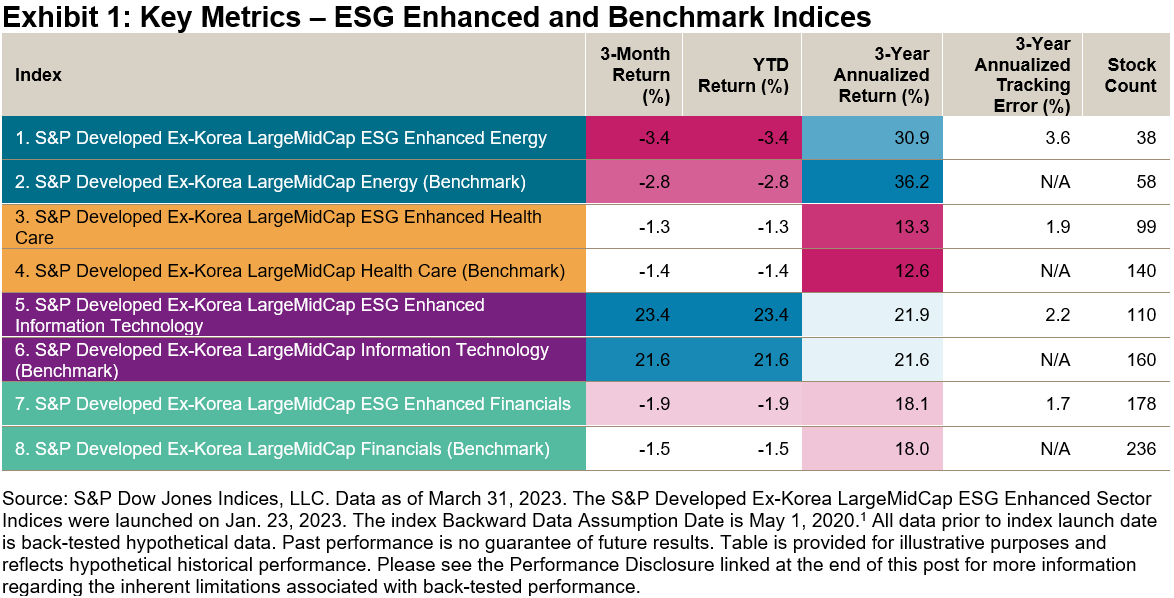
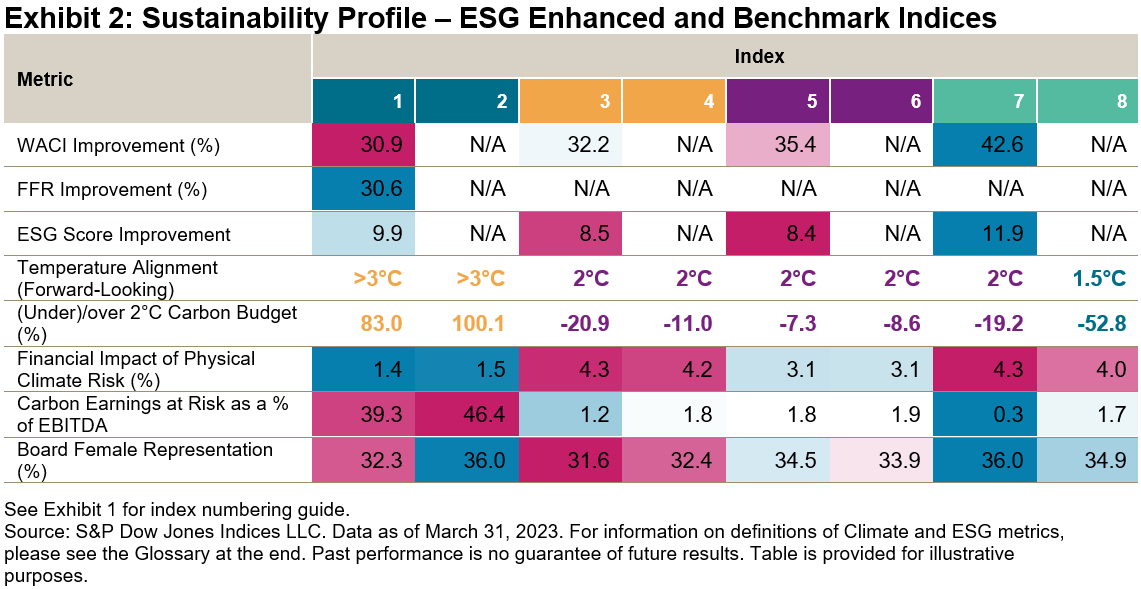
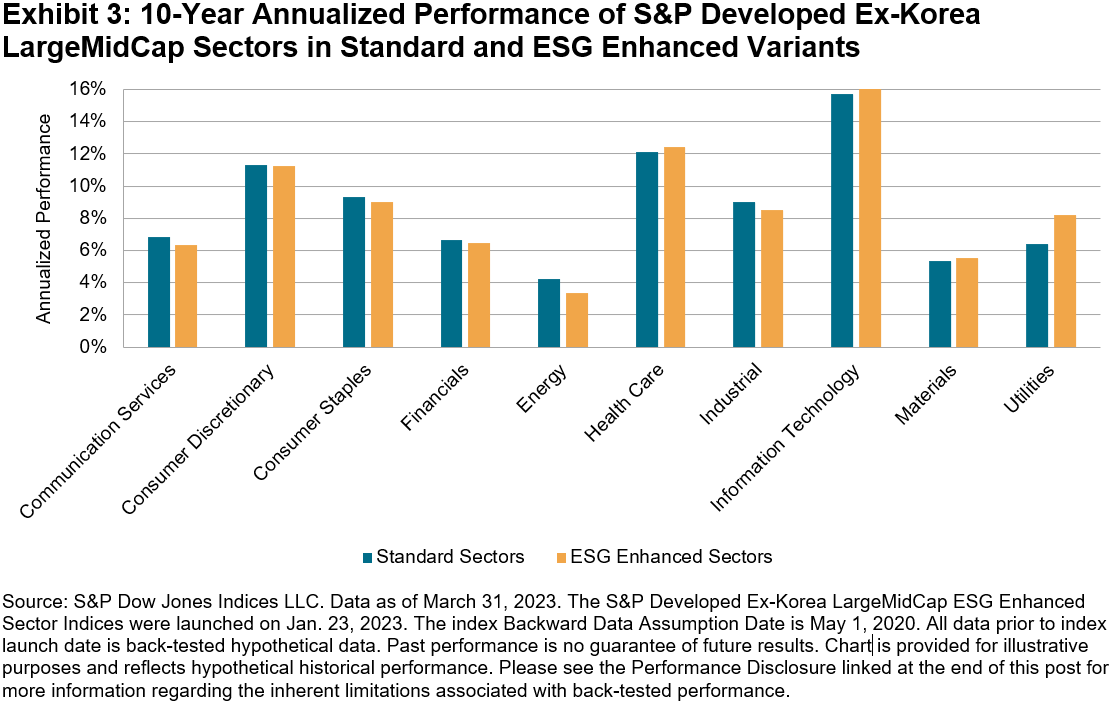
The four S&P ESG Enhanced Sector Indices achieved significant ESG score and weighted average carbon intensity (WACI) improvements against their benchmarks, while maintaining tracking error ranges from 1.7% to 3.6%, for the Financials and Energy sector variants, respectively, and similar annualized returns across the full suite (see Exhibit 3). In addition to improvements in ESG score and WACI, these indices also achieve benchmark-relative enhancements in other climate metrics, such as carbon earnings at risk as a % of EBITDA as of March 31, 2023.
Exhibit 3 shows that even the limited tracking error reported in Exhibit 1 largely cancelled out over a longer (back-tested) performance horizon, for the whole range of S&P ESG Enhanced Sector Indices. Over the 10 years ending March 2023, the differentials in annualized total returns ranged from -0.1% to 1.8% across all 11 ESG-enhanced sectors, with an annualized average absolute difference of just 0.5%.
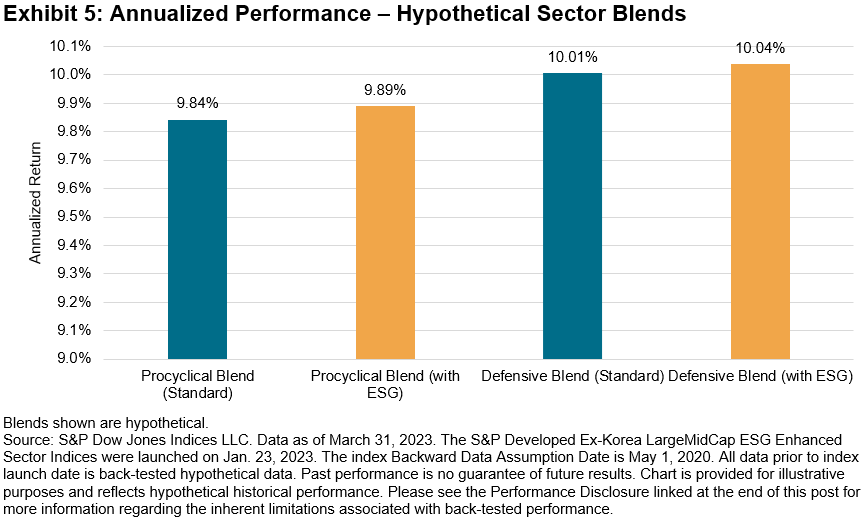
But what about a hypothetical multi-sector allocation? To offer an illustration, a common approach is to harness the different risk and performance characteristics of sectors to navigate the market’s cycles. Sectors considered “defensive” are typically preferred in falling markets, while “procyclical” sectors are often preferred in rising markets. To evaluate the compatibility of ESG-enhanced sectors with such approaches, we constructed four hypothetical portfolios, with and without the substitution of selected ESG variants (see Exhibit 4).
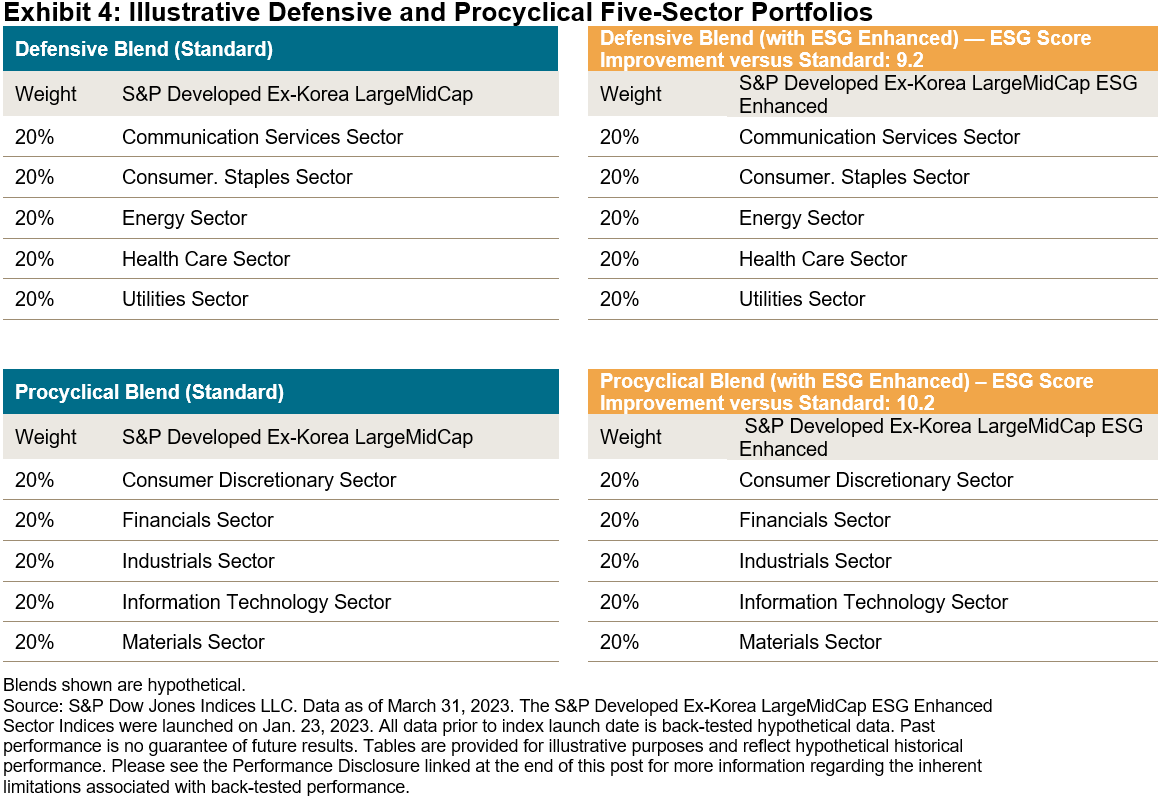
Results for the four blends over a decade suggest that the substitution of ESG-enhanced sectors did not substantially alter the performance profile of the defensive and procyclical blends, as shown by similar outcomes for combinations with and without the S&P ESG Enhanced Sector Indices (see Exhibit 5, based on 10-year returns as of March 2023).
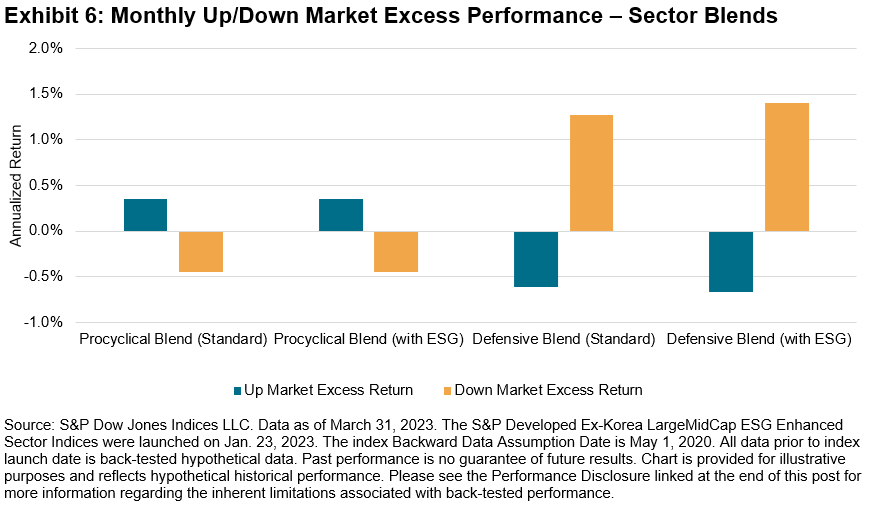
Bucketing periodic excess returns by months when the S&P Developed Ex-Korea LargeMidCap was rising (up markets) or falling (down markets) further illustrates the compatibility of ESG-enhanced sectors with traditional defensive and procyclical approaches (see Exhibit 6). In a hypothetical blended portfolio, these behaved collectively even more like traditional sector indices, with a tracking error of only 2.1% for the Procyclical Blend with ESG and 2.2% for the Defensive Blend with ESG. These figures are lower compared to tracking error in ranges from 1.7% to 3.6% when ESG-enhanced sectors are considered in isolation.
Overall, these exhibits showcase that building sustainability elements into sector indices may not necessarily come at the cost of desired benchmark-like characteristics. These indices offer the best of both worlds: an enhanced sustainability profile with performance characteristics closely aligned with traditional sector-based index strategies, making them a potentially valuable tool in the investor kit. Key performance and sustainability metrics for these indices can be monitored in S&P DJI’s Quarterly Climate & ESG Index Dashboard.
The author would like to thank Joseph Nelesen for his contributions.
GLOSSARY
WACI: Weighted Average Carbon Intensity. The index weighted average of individual company intensities (Scope 1, Scope 2, Scope 3 upstream and downstream emissions, normalized with enterprise value including cash).
FFR: Fossil Fuel Reserves. The carbon footprint that could be generated if the proven and probable fossil fuel reserves owned by index constituents were burned per USD 1 million invested.
Financial Impact of Physical Climate Risk: Financial losses (e.g., CapEx, OpEx, Business Interruption) reflected as a percentage of asset value due to exposure to climate-related physical hazards across scenarios and time periods. High Risk Scenario and 2050 time period are used for this Exhibit.
Carbon Earnings at Risk as a % of EBITDA: This dataset helps to understand and assess the potential impact to a company’s earnings today if the company has to pay a future price for their greenhouse gas emissions.
WAECI: Weighted Average Environmental Cost Intensity. This dataset helps to assess the index weighted average of environmental costs across key dimensions such as carbon emissions, land, water, air pollutants, and waste disposal, natural resource and water use.
Board Female Representation (%): The index weighted average of the number of women on a company’s board of directors/supervisory board divided by the total number of board directors.
1 Backward Data Assumption Date: FAQ: ESG Back-Testing – Backward Data Assumption Overview
Disclosure: Copyright © 2023 S&P Dow Jones Indices LLC, a division of S&P Global. All rights reserved. This material is reproduced with the prior written consent of S&P DJI. For more information on S&P DJI please visit S&P Dow Jones Indices. For full terms of use and disclosures please visit Terms of Use.
Original Post
Editor’s Note: The summary bullets for this article were chosen by Seeking Alpha editors.
Credit: Source link


