for personal or commercial purposes/iStock via Getty Images
If trouble comes when you least expect it, then maybe the thing to do is to always expect it. – Cormac McCarthy.
The Invesco S&P SmallCap Information Technology ETF (NASDAQ:PSCT) is a ~$300m valued exchange-traded fund, or ETF, that focuses on 69 U.S. small-cap stocks that are involved in tech-related products and services, including computer hardware & software, Internet, electronics and semiconductors, and communication technologies.
I can appreciate the temptation to wedge yourself to these small-cap names when tech continues to be a ubiquitous and integral cog of the 21st century. Besides, these stocks are also well set to benefit from the growing influx of digitization that could stimulate market-cap expansion over time. It also helps that PSCT’s portfolio of stocks looks set to deliver long-term earnings growth of 14%, at a time when the average real GDP growth of the U.S. could come in at less than 2% on average, through 2026.
All this is very well, but I believe there’s a time to pursue a portfolio of PSCT’s ilk, and I don’t think that time is now. Here’s why.
The Conditions Aren’t Right
There are two broad components to the PSCT story – the tech component, and the small-cap component; my concerns are primarily centered around the latter.
If you’ve followed The Lead-Lag Report commentary over the years, you’d note that I’ve previously expressed concerns about how investors tend to give undue importance only to the benchmarks, often paying scant regard to market internals, which can be very useful in identifying market tops and bottoms. When I look at the internals, I feel something is amiss, and one of the segments that validate my fears is the small-cap segment.
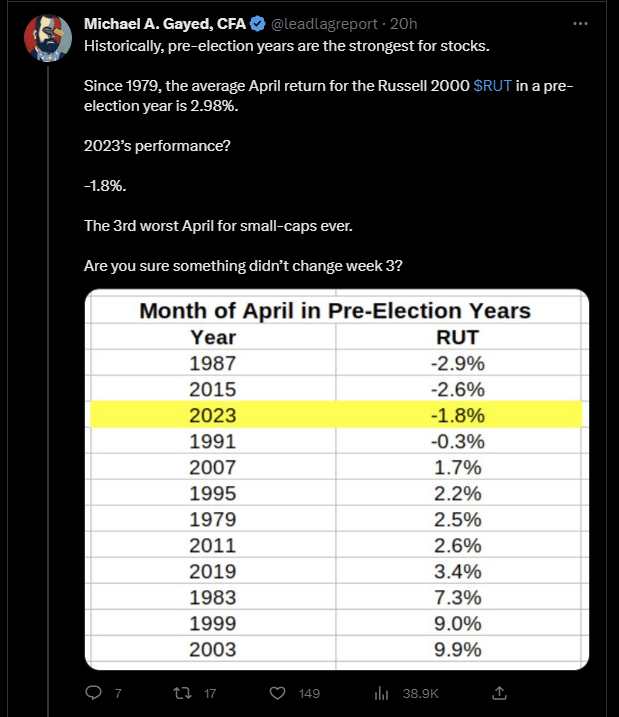
Typically, in a pre-election year, April has largely always been quite healthy for risk assets, but as noted in a Twitter thread on the timeline of The Lead-Lag Report, last month, the small-cap-oriented Russell 2000 just went through its 3rd worst April in its history, reiterating the lack of support for risk assets.
Twitter Twitter Twitter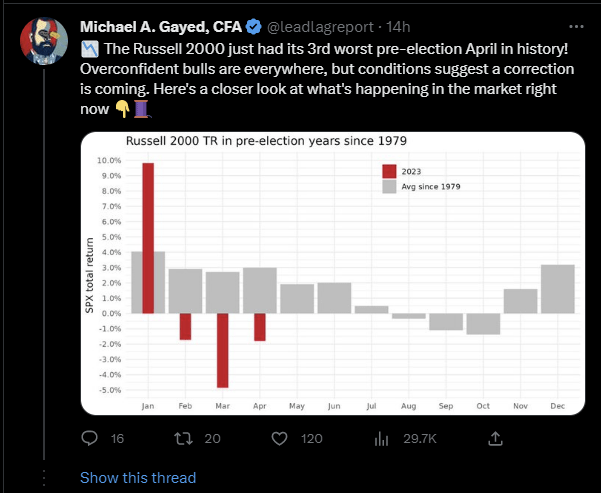
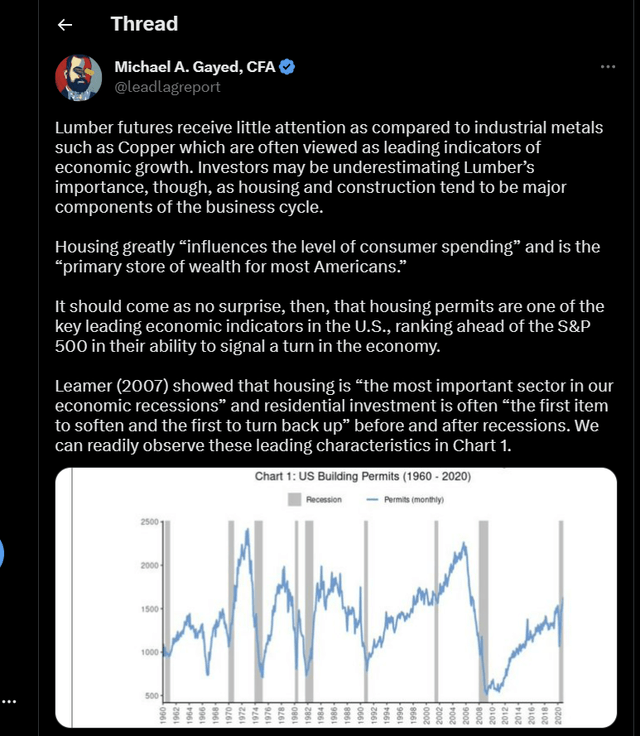
Adverse risk sentiment is further validated by the performance of Lumber, which many of you may know is my domain expertise and something I use to ascertain risk-on/risk-off conditions in the financial markets. To get a better understanding of my risk-off thesis, investors may consider reading my recent article on Investor Place where I’ve highlighted how dynamics in the lumber market could kickstart interest in safe-havens such as treasuries.
Basically, I believe Lumber is a “tell” on housing, which in turn is a “tell” on the economy. It’s been quite troubling to discover that lumber prices recently plummeted to their lowest level since May 2020, and I believe this is a reflection of the heightened exposure that regional banks have to the real-estate sector. It is well documented that all is not well in the banking sector, and an inevitable tightening up of credit could weigh heavily on the entire economy.
If the economy’s prospects aren’t great, the broader markets will reflect this. And when the broader markets are in trouble, what does it say about the prospects of high-beta names such as PSCT (the 5-year beta is now at 1.25x) that likely remain vulnerable to a more pronounced selloff.
YCharts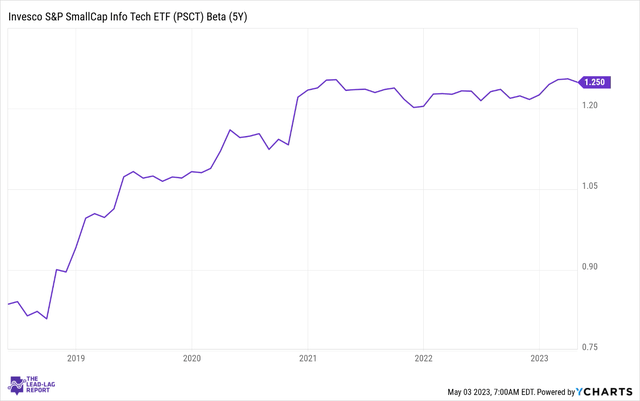
In fact, you’d be interested to note that over the past month, PSCT’s assets under management, or AUM, has already declined by double digits, even as the broader markets have remained steady. During this period, even the large-cap focused XLK has only witnessed single-digit declines in its AUM.
YCharts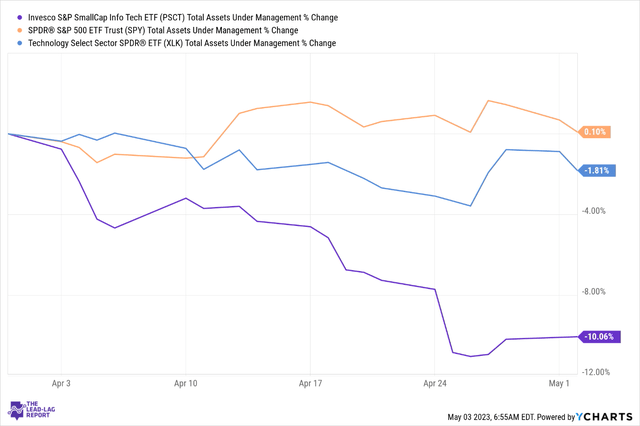
And that isn’t all; questions may even be asked about the breadth of large-cap tech cohort isn’t witnessing quality breadth; rather, as noted in a tweet on the timeline of The Lead-Lag Report, an equal-weighted basket of tech stocks actually declined by 1% last week. Whatever outperformance your seeing is just a function of a few mega-cap tech names.
Twitter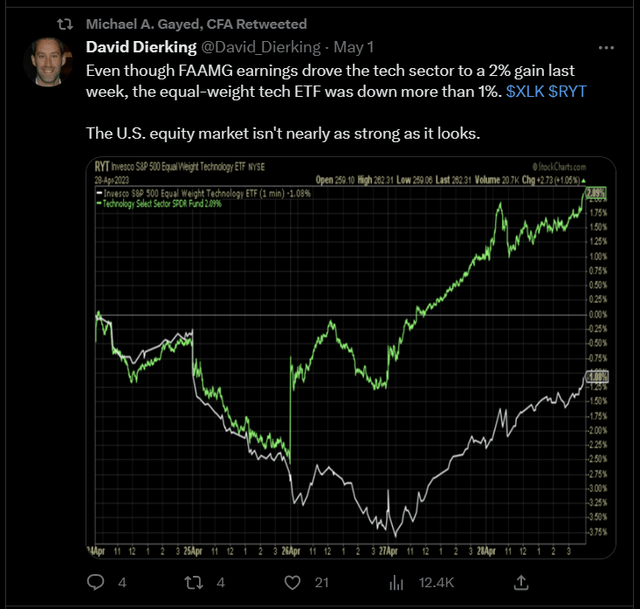
I also noted that the proportion of stocks trading above their 200DMAs in the tech-heavy Nasdaq peaked quite some time ago.
Twitter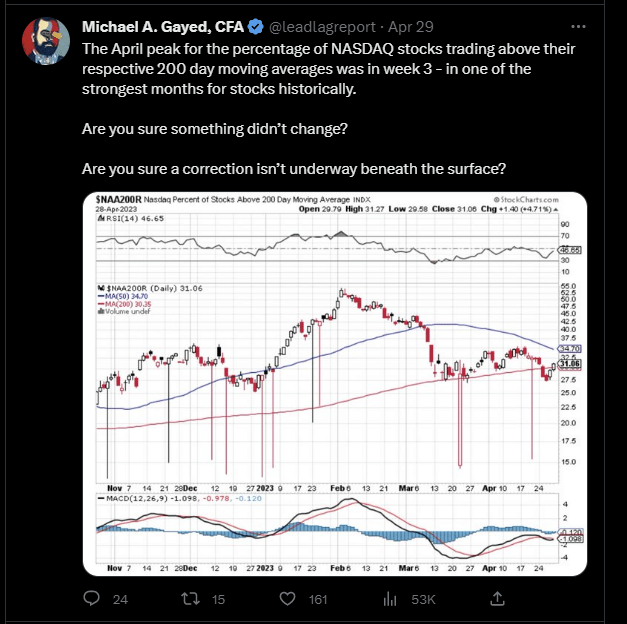
If the more well-rounded and well-diversified large-cap tech business models are losing favor with investors in the current phase of the economic cycle, what can one expect from small-cap tech stocks that are more uni-dimensional in their offerings, with exposure primarily oriented to the domestic shores? Within the broad tech universe, it doesn’t help that PSCT’s holdings are predominantly electronic hardware or semiconductor-based entities. During a down cycle, these segments are unlikely to find too many takers, and we’ve recently seen how semiconductor revenue growth forecasts for FY23 (-11% expected decline) were scaled down yet again by Gartner.
I also think PSCT’s constituents could have expected some support if its major holdings were trading at cheap valuations, but that is hardly the case. On average, the top 10 stocks currently trade at a ~5% premium relative to the historical average.
|
PSCT Top 10 |
Current Forward P/E |
Forward P/E 5-Yr average |
Variance % |
|
SPS Commerce |
54.76 |
56.14 |
-2.5% |
|
Rambus |
25.66 |
15.77 |
62.7% |
|
Onto Innovation |
22.12 |
20.00 |
10.6% |
|
Axcelis Technologies |
19.89 |
21.55 |
-7.7% |
|
Badger Meter |
50.50 |
40.84 |
23.7% |
|
Diodes |
13.33 |
17.11 |
-22.1% |
|
Insight Enterprises |
12.27 |
11.88 |
3.3% |
|
Fabrinet |
12.29 |
16.04 |
-23.4% |
|
Advanced Energy Industries |
19.30 |
18.30 |
5.5% |
|
Sanima Corp |
8.28 |
10.33 |
-19.8% |
|
AVERAGE |
23.84 |
22.80 |
4.6% |
Source: Seeking Alpha.
Meanwhile, Invesco S&P SmallCap Information Technology ETF investors should also note that within the broad small-cap space, as represented by the Russell 2000 Index (IWM), small-cap tech still remains one of the most overextended trades, with relative strength ratio still quite heightened despite a recent pullback.
StockCharts.com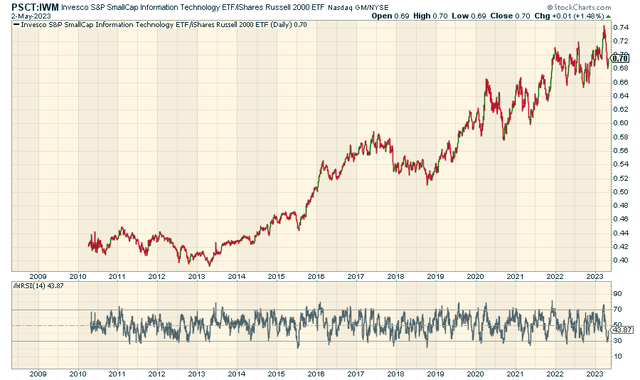
Credit: Source link


