tadamichi
In this article, we take a look at the PIMCO Global StocksPLUS & Income Fund (NYSE:PGP). The fund has two distinguishing features in the taxable PIMCO suite. One, its portfolio is roughly balanced between equities, credit and “risk-free” assets and two, it trades at the lowest valuation in the suite.
Below, we take a look at the fund’s strategy, its allocation, and the valuation. Our takeaway is that the fund has an attractive profile for investors looking for an “all-market” investment vehicle. PGP trades at an 11.5% current yield and a 0.4% discount.
Strategy
What makes PGP unique in the PIMCO CEF suite is its hybrid equity/credit strategy. The fund’s stated mandate is not exactly the epitome of transparency. The overview states:
Employing the innovative StocksPLUS approach, pioneered by PIMCO, the fund seeks total return composed of current income, current gains and long-term capital appreciation. The portfolio manager builds a global equity and debt portfolio by investing at least 80% of the fund’s net assets (plus any borrowings for investment purposes) in a combination of securities and instruments that provide exposure to stocks and/or produce income.
Few investors are likely familiar with StocksPLUS and saying that 80% of the portfolio is allocated to either stocks or income securities is not very enlightening, as we’d be hard pressed to name a lot of financial securities that are neither stocks nor income-generating.
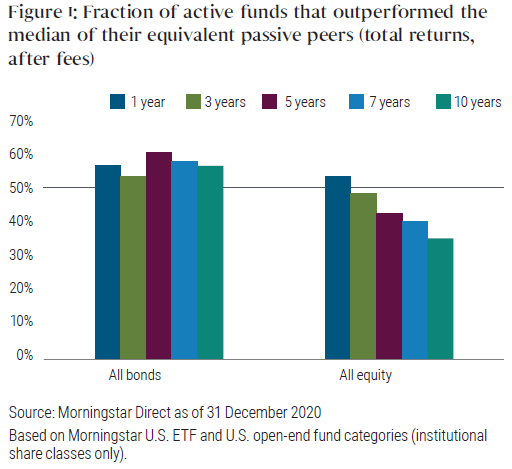
What is the StocksPLUS approach? The essence of this approach is tied to the task of outperforming stocks. The traditional approach to outperform stocks is to be really good at picking stocks. PIMCO’s view is that this approach does not appear to work, as most equity managers end up underperforming stocks. PIMCO’s solution to the problem of outperforming stocks is, instead, to hold stocks passively and slap some credit on top of stocks.
According to the company, this approach should work for two reasons. One, the additional credit element will generate returns over and above that of stocks, over the longer term. Two, active management in credit is significantly easier than active management in equities. PIMCO even wrote a whole paper discussing why. It also provides a handy chart, supporting its thesis.
PIMCO
Fund Profile
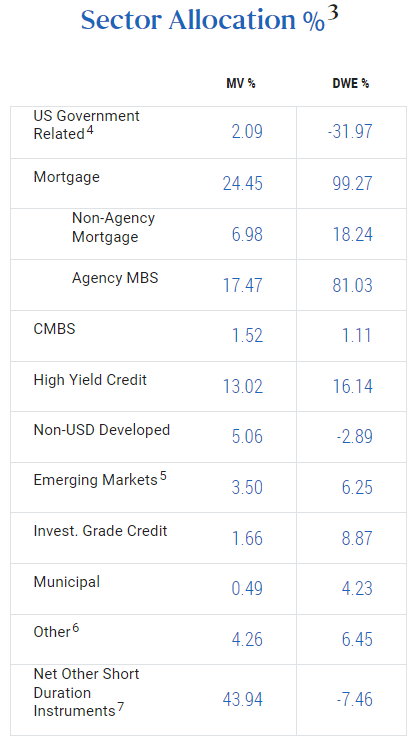
Now that we have a decent sense of the strategy, let’s have a look at the fund’s actual portfolio. Normally, the best way to get a sense of a fund’s portfolio is to look on the website, which is where we get the table below. To say that this is a waste of time would be too kind to PIMCO. Not only do we not see any equity allocation, we get a totally misleading and massive “Net Other Short Duration Instruments” position.
PIMCO
To get a sense of the actual portfolio, we need to look at the holdings’ spreadsheet. There we get the usual positions in loans, corporate bonds, mortgages, ABS and other sundry assets. What we don’t really get is a standard picture of its equity holdings.
The equity allocation is actually split up into three separate parts. The easiest to track is the section called “Common Stocks” which makes up $7.9m of assets.
For the second section you need to scroll down to the “Derivative Instruments” which will show S&P 500 E-Mini Futures, puts and calls. Specifically, there are 170 long June contracts, 161 short April calls struck at 5220 and 161 long April puts struck at 4960.

PIMCO
As a percentage of net assets, these sum up to about zero. The reason this doesn’t clear things up is for three reasons. One, these are derivatives, not cash assets. Two, they point in different directions. And three, some are linear (futures) while others are not (the puts and calls). In short, we can’t just add up the numbers in the spreadsheet to get a sense of how big these positions are.
To figure out the size of the Futures position, we need to multiply the number of contracts (170) by the contract size of the E-Mini Futures ($50) by the level of the index today, which works out to around $43m.
Now we need to do the same for the Calls and Puts with the added difficulty that we need to work out the deltas for these options to convert them into a Futures equivalent or linear position. With the deltas around 0.3, the Futures-equivalent position is -$12.4m for the puts and -$10.9m for the Calls. Summing everything up, we get an S&P 500 position of around $19.7m. An added difficulty here is that the deltas of the options will move daily, so the size of the S&P 500 position will change slightly.

Systematic Income
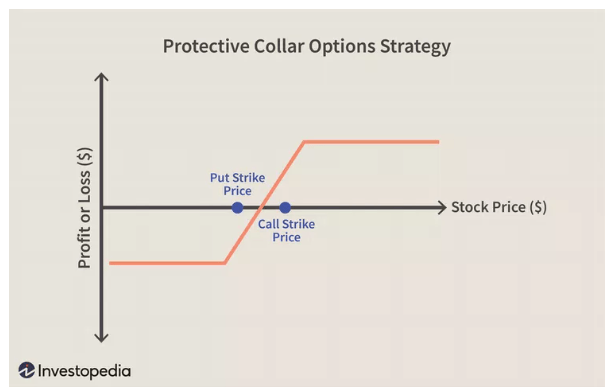
Investors familiar with options strategies may pick up on the fact that this is a collar.
Investopedia
And in fact, it is part of the fund’s explicit strategy. The premium received for the short call goes, in part, to pay for the put. The collar keeps the volatility of the position more limited than it would be otherwise had it been a straight long futures position.
The fund may employ a strategy of writing (selling) equity index call options on the U.S. equity portion seek to generate gains from option premiums, which may limit the fund’s gains from increases in the S&P 500 Index. The fund may also purchase put options on the S&P 500 in an effort to protect against significant market declines.
This also highlights that the StocksPLUS name is not quite correct and should rather be something like StocksPLUSEquityCollarPLUS. In other words, we shouldn’t expect the fund to behave like a pure equity fund, but rather as a mix of equity and covered call fund. Historically, covered call funds have underperformed their equity benchmarks, and so we should probably not expect PGP to compete with pure equity funds.
Turning to the third and last Equity position, we need to scroll down to the Total Return Swap section.

PIMCO
A Total Return Swap is a financial instrument that replicates the behavior of some underlying index, but does it synthetically. In this case, the index in question is the MSCI EAFE i.e. developed-market ex-US large and mid-cap equities.
This allocation echoes the fund’s Equity strategy as shown in this extract.
The Fund’s equity index exposure generally is expected to equal 100% of its net assets (generally approximately 50% U.S. and 50% non-U.S.)
The $37.7m is the right number here, as it’s likely the notion of the TRS. So, all in all, we have $7.9m in individual stocks, $19.7m in an S&P 500 position and $37.7m in a MSCI EAFE position for a total Equity position of $65.3m.
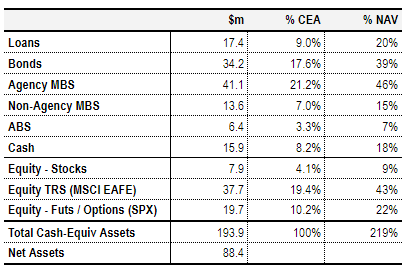
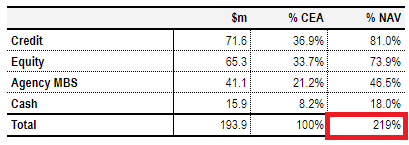
When we add all the other sectors, we get the following table. Unlike the nonsense on PIMCO’s website, this table shows everything in cash-equivalent assets. In other words, the table shows asset allocations as though everything was held in cash/physical assets rather than derivatives (we are ignoring interest rate swaps and FX) i.e. on an apples-to-apples basis.
Systematic Income
If we look at the Total Investments figure in the spreadsheet it sums up to only $132m rather than the $194m cash-equivalent figure here for the simple reason that it uses the market value of the Equity positions which sums up to around $12m rather than the actual cash-equivalent risk position of $65.3m. Investors looking at a $12m Equity position relative to the NAV of $88m will think that it’s fairly benign whereas, in fact, it is 74% of net assets.
In other words, the mark-to-market of synthetic/derivative assets will typically understate their actual risk exposure. For example, a $100m on-market interest rate swap will behave like a $100m bond despite having zero market value
Why does PIMCO say its mandate is to hold 100% of the NAV in Equities, but it only holds 74% of the NAV in Equities. The answer has to do with the collar position that mutes its overall size. If we sum up only the long MSCI EAFE TRS and long S&P 500 Futures positions, we get to 92% of NAV ($37.7m MSCI EAFE + $43m S&P 500) – pretty close to 100%. However, this is reduced by the short Call and long Put S&P 500 holdings once they are factored in.
If we sum everything up by asset class, one striking feature is immediately apparent, which is that total (cash-equivalent) assets are 219% of the NAV. In other words, if the fund’s Equity position were held as cash assets rather than derivatives (i.e. “synthetic assets”), the fund’s leverage would be 54.4%.
Systematic Income
This level of economic leverage is basically unheard of in the CEF space, where 45-50% is about as high as funds go. One reason why we are not particularly worried about such high leverage is that cash is 18% of the NAV and Agency MBS is a massive 47% of the NAV. In other words, 2/3 of the NAV is in pretty low-risk assets. Recall that during the COVID shock, although there was a near-death experience for many mortgage REITs, Agency MBS actually rallied because Treasury yields fell more than Agency spreads widened.
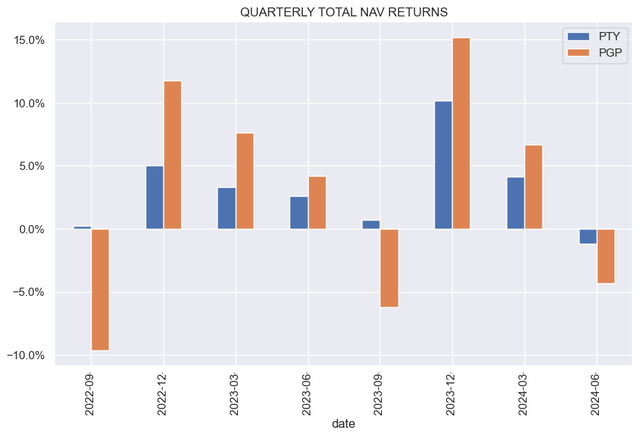
In short, although the fund’s actual leverage level is sky-high and miles above what you will find on its website, its actual risk profile is more modest than it might seem. That said, its total NAV returns will tend to be more volatile than that of its sister PIMCO funds.
Systematic Income
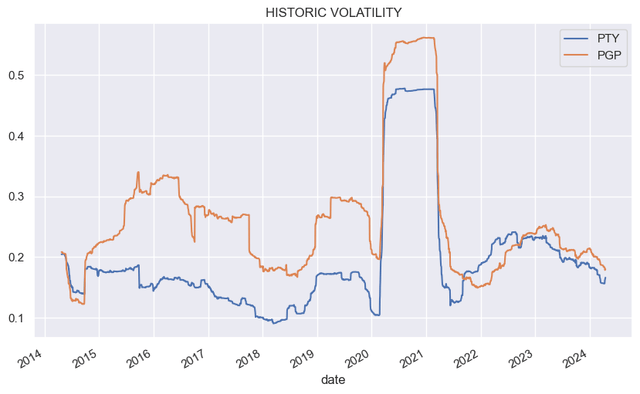
At the same time, its historic price volatility is less than it has been in the past and not much above that of PTY.
Systematic Income
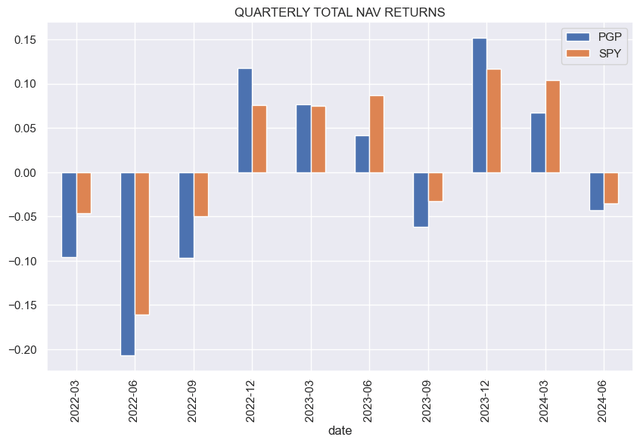
To get a sense of how PGP performs against the S&P 500, we see that it has tended to be more volatile than the index, though not in every quarter. This in large part is due to the fact that credit risk tends to move in the same direction as Equities.
Systematic Income
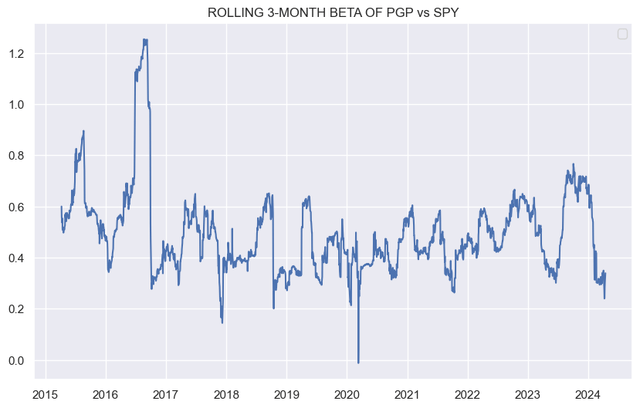
The fund’s beta to the S&P 500, however, has been relatively subdued, as we would expect given its collar strategy. For each 1% move in the S&P 500, the fund tended to move less than half that.
Systematic Income
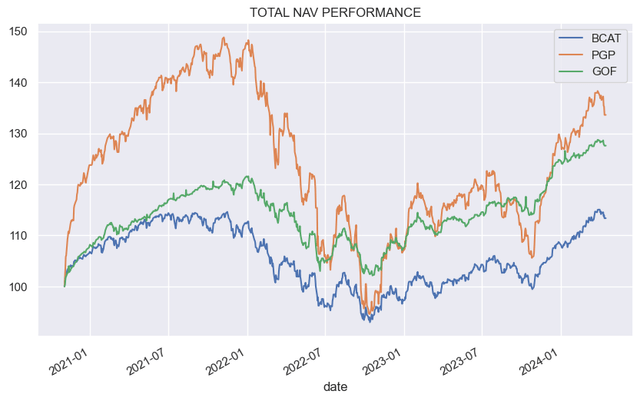
Relative to a number of other Hybrid CEFs, PGP has done pretty well. This chart starts with the inception of BCAT.
Systematic Income
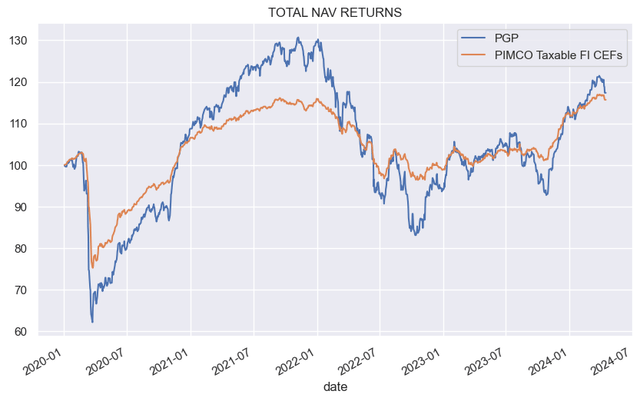
Relative to other PIMCO CEFs, PGP has done only marginally better if we look at the post-2020 performance. Much of this is due to the tepid performance of ex-US developed-market stocks, as well as the collar strategy for the strongly-performing US stocks.
Systematic Income
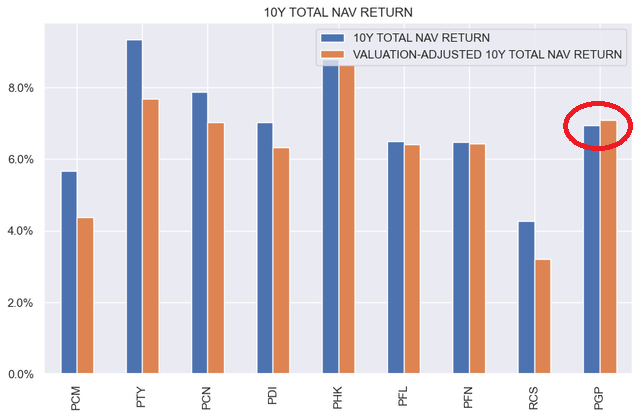
Across the PIMCO suite 10Y total NAV returns (blue bars below) for the fund are respectable. Where it gets interesting is in the orange bars which show a valuation-adjusted 10Y total NAV return which is simply the return divided by (1 + valuation).
Systematic Income
Because PGP trades at a slight discount, it means the orange bar is ahead of the blue bar. Similarly, funds like PTY or PCN have an orange bar that is smaller than their blue bars and not much above that of PGP. This measure takes into account that a dollar of investor capital does not buy a dollar of a fund’s NAV and is a more accurate measure of future relative returns on investor capital, using historic NAV returns as a baseline. By this measure, PGP looks quite attractive.
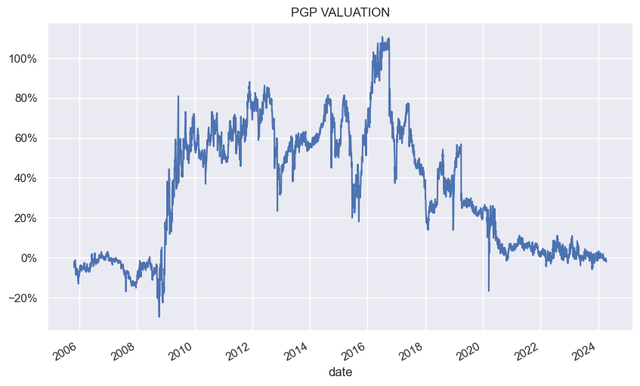
The fund’s valuation has deflated historically. This is in large part because of distribution cuts, something we have seen across all PIMCO CEFs to a varying degree.
Systematic Income
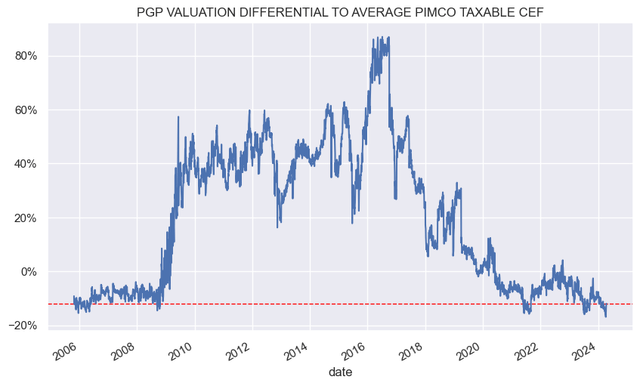
This has pushed the fund’s valuation to a double-digit relative discount against other taxable PIMCO CEFs – a level it has not seen consistently for around 15 years.
Systematic Income
While cheap in the context of other PIMCO CEFs, it’s fair to say that the fund is still not cheap on an absolute basis or relative to other Hybrid sector CEFs as shown below.

Systematic Income CEF Tool
The fund’s distribution coverage is not particularly inspiring at 56% on a 6-month basis, though it is not far off the rest of the taxable suite. We are less worried about PGP on this front for several reasons. One, some of the fund’s income is generated via the covered call position, which is unlikely to be captured as net income. Two, PGP has the lowest NAV distribution rate within the taxable PIMCO suite already. Three, the fund’s distribution can be supported by its equity allocation, a missing element in the rest of the PIMCO suite. Finally, its high-quality lower-yield allocation will allow it to reallocate to higher-yielding assets in case of a market bump, which appears to be developing already.
Overall, we view PGP as approaching an attractive entry point, particularly if stocks move lower. Its valuation within the PIMCO suite is also attractive. And its high-quality credit allocation with a significant overweight of Agency MBS gives it a lot of dry powder to put to work if the current sell-off continues. Finally, it combines a number of strategies in one package – call overwriting, equities, high-quality duration and credit, offering a kind of one-stop shop for investors.
Editor’s Note: This article covers one or more microcap stocks. Please be aware of the risks associated with these stocks.
Credit: Source link


