ssuaphoto
Looking for high yield income from the Energy sector, without having to do the heavy lifting? There are several CEFs, closed end funds, that focus on the Energy sector, and offer high yields, such as the Neuberger Berman Energy Infrastructure and Income Fund (NYSE:NML).
Fund Profile:
NML is a non-diversified, closed-end management investment company that invests primarily in energy infrastructure companies, with an emphasis on the midstream natural resources sector.
The fund seeks total return with an emphasis on cash distributions.
In addition to focusing on midstream energy companies, the Fund’s investments may include companies focused on alternative energy sources, including renewables and alternative fuels.
NML’s management uses 17.2% leverage to increase the fund’s returns. It holds just 31 positions, with an average daily volume of 229K, and an expense ratio of 2.95%.
Hidden Dividend Stocks Plus
Dividends:
NML pays monthly distributions, which are currently $0.0584/month. Management lowered the monthly payouts during the Covid crisis, from $0.0550 to $0.0117, gradually increasing them to $0.0227 in Q3 ’22. They then increased them to $0.0584/month in December 2022.
At its 6/12/24 price of $7.72, NML yielded 9.08%. It goes ex-dividend next on 6/17/24, with a 6/28/24 pay date.
The hefty 21.75% 5-year distribution growth is due to the 147% rise in 2023, when distributions rose to $.70, vs. just $.28 in 2022.
Hidden Dividend Stocks Plus
NML’s fiscal year ends on November 30th. In fiscal 2023, NII was -$4.06M, way down vs. -$1.1M in fiscal ’22. Net Realized Gain on Investments increased to $24.9M, vs. $21.86M in fiscal ’22.
Distributions nearly tripled in fiscal 2023, to $39.71M, vs. $13.68M in 2022, whereas Net Assets decreased by ~$40.4M, after rising ~$136.6M in fiscal ’22:
NML site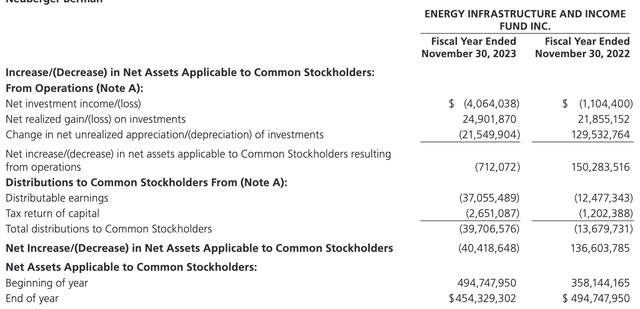
Taxes:
2023 distributions of $.70 came from $.65 in NII, and $.05 in Return of Capital, ROC. 2022 distributions of $.24 were derived from $.22 of NII and $.02 in ROC. NML had a 3-year period, 2019 – 2021, when 100% of its distributions came from ROC.
ROC offers you a tax deferral advantage, but it does reduce your tax basis, which comes into play when and if you sell your shares.
NML site
Holdings:
As of 3/31/24, Natural Gas represented 70% of NML’s holdings, followed by Crude Oil, at 13%, Utilities, at 10%, Renewables, at 3.5%, and cash, at 3%.
NML site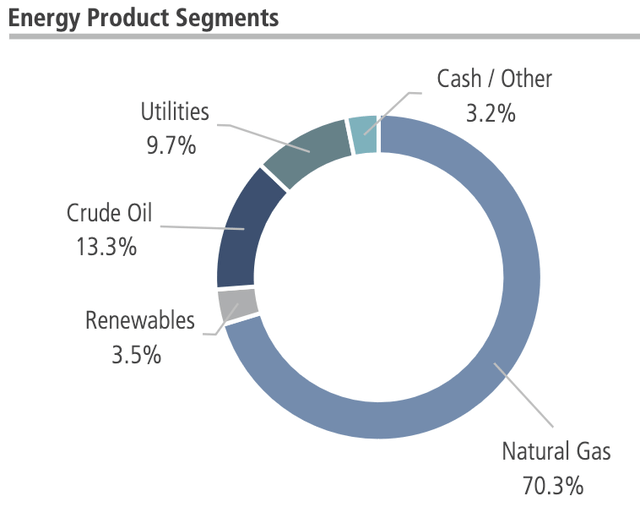
$50B-plus market cap companies represented 31.5%, with $20-$50B firms at 29.6%, $10B-$20B caps, at 11.8%, and $5B-$10B caps at 20.4%:
NML site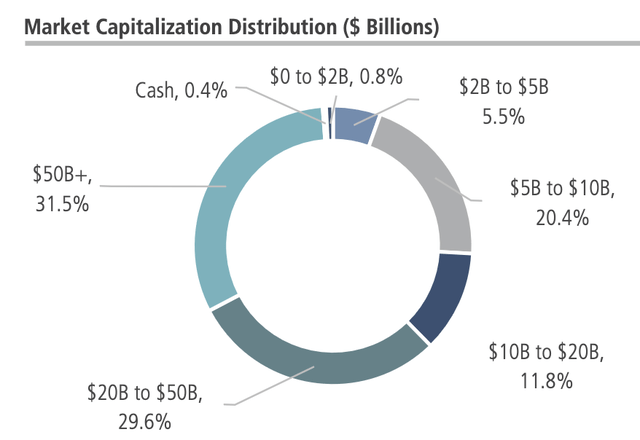
NML’s top 10 holdings represented 66% of its portfolio, with Energy Transfer LP (ET), Targa Resources (TRGP), and Enterprise Products Partners LP (EPD) all ~10-11%, and comprising ~30%.
NML site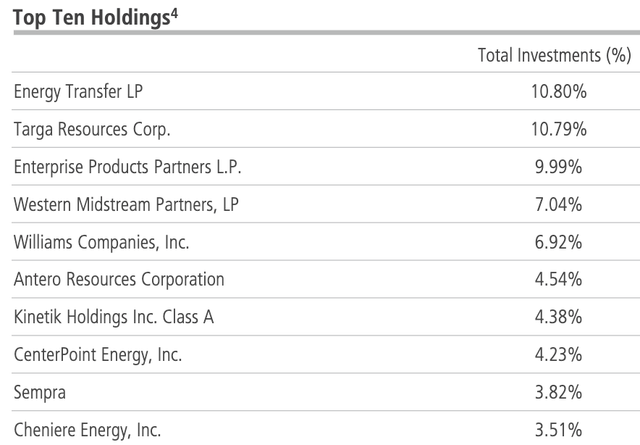
Performance:
Looking under the hood to check out the performance of these top 10 holdings shows that 7 of them have outperformed the S&P 500 and the Energy sector over the past year, on a total return basis, with Targa Resources (TRGP) and Western Midstream (WES) at the top of the heap; and Cheniere and Sempra at the bottom.
NML also outperformed the S&P and the Energy sector on a total return basis over the past year.
So far in 2024, 5 of the top 10 have outperformed the S&P, while 8 have outperformed the Energy sector. NML has also outperformed the Energy sector year to date, but slightly lags the S&P.
Hidden Dividend Stocks Plus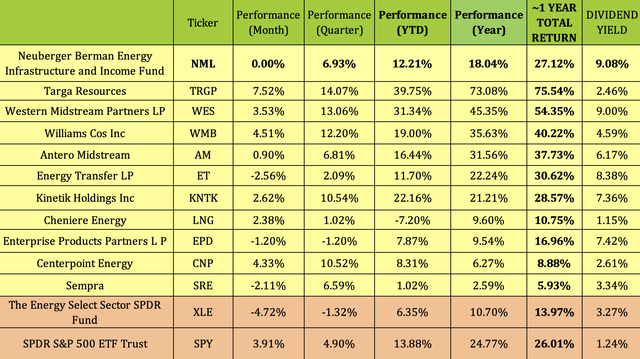
NML outperformed the Morningstar US CEF MLP category in 2019 – 2022:
NML site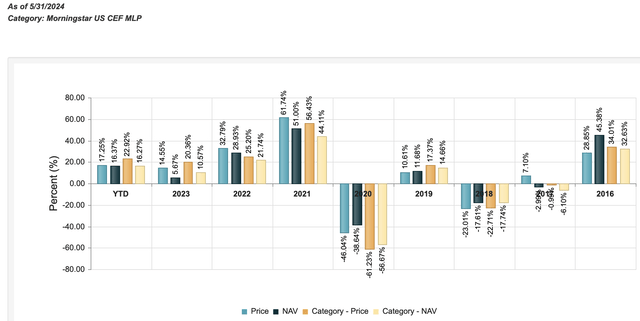
NML’s average annual return from inception was -0.63% on NAV, and -2.43% on price, as of 11/30/23.
NML site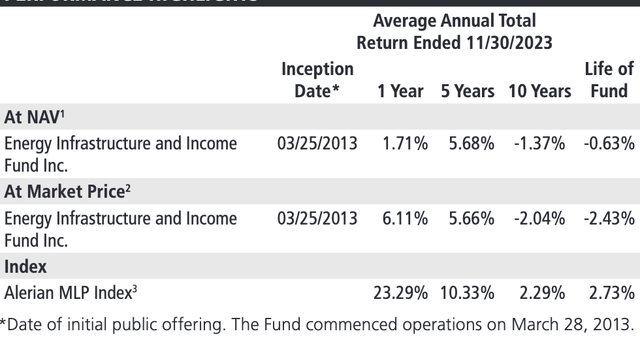
Valuations:
Buying CEF’s at deeper than historic discounts to NAV can be a useful strategy, due to mean reversion. CEFs’ daily valuations are calculated at the end of each trading day.
At its 6/11/24 closing price of $7.76, NML was trading at an 11.3% discount to NAV/Share. While that sounds pretty appealing, it’s not nearly as deep of a discount as its 1-, 3-, and 5-year averages of -13.5%, -16.97%, and -17.7%, respectively.
Hidden Dividend Stocks Plus
Like almost everything else, NML’s pricing tumbled during the 2020 Covid crisis. The discounts have persisted since then, but at steadily lesser values. As of 6/11/24, NML’s 3-month Z score was 1.62, vs. 1.74 over the past year.
NML site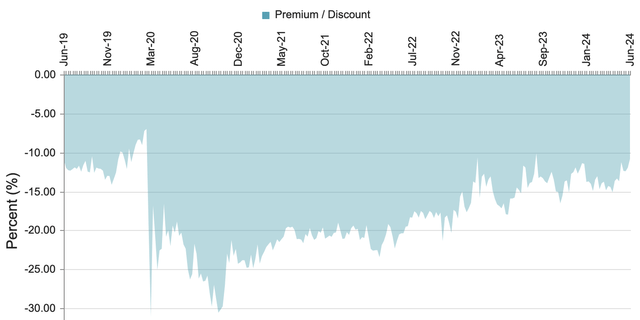
Parting Thoughts:
We’re going to pass on NML for now – its discount, although deep, isn’t deeper than its 1, 3, and 5-year averages, and its long-term returns don’t justify climbing aboard at this time.
All tables furnished by Hidden Dividend Stocks Plus, unless otherwise noted.
Credit: Source link


