


Nvidia World Headquarters wellesenterprises
When I last covered the Invesco QQQ Trust (NASDAQ:QQQ) ETF, I rated it a buy because I thought that the growth being observed in large QQQ components at the time was enough to justify the fund’s steep price tag (it traded at about 30 times earnings at the time). Although the QQQ has actually declined slightly in price since my previous article, I now see things differently than I did when I wrote it. While the last round of big tech earnings showed high growth, most of the tech giants guided for increased capital expenditure in the quarters ahead. Google (GOOG) and Meta Platforms (META) in particular pledged to spend large sums of money on AI infrastructure and other investments in the second half.
After seeing this, I decided to continue selling big tech stocks, as I had been doing intermittently in the first half of this year. Today, Google is the only large U.S. tech stock remaining in my portfolio-and even that position I’ve reduced considerably. I exited QQQ long ago.
So, why am I changing my rating back to sell, after briefly going bullish?
It comes down to a combination of several factors. The CAPEX increase just mentioned isn’t certainly not thesis breaking for QQQ in and of itself, but when you combine that with valuation concerns and the relative lack of profitability in big tech’s AI investments (except NVIDIA), you begin to see a clear picture: a group of very pricey stocks that are not actually making money off the big catalyst that made them expensive in the first place.
The recent rally in tech stocks was somewhat unexpected. The macroeconomic developments of the last year basically would have predicted a longer lasting bear market than the one we got in 2022. Interest rates rose in 2022, at the fastest pace in modern history. They continued rising in the first half of 2023, and plateaued from then until today. Only in the last month did we hear a clear pledge from the Federal Reserve to cut rates at the September meeting.
Normally, we expect higher rates to produce lower stock prices. When you discount a company’s cash flows, the discounted value ends up being lower when the discount rate (treasury yield plus risk premia) is higher. Also, high rates make borrowing expensive. For these reasons, people generally assume stocks will go down when rates go up. Indeed, the first three quarters or so of 2022, when the rate hiking spree was getting started, did correspond to a pretty major bear market. However, the selloff ended in October of that year.
What brought the bear market to an end-at least in this Author’s opinion-was not any change in monetary policy (it didn’t change much for an entire year), but rather a new product: ChatGPT. ChatGPT launched in November 2022, just a month after the S&P 500 bottomed. The product wowed Twitter users, a fact that led to it becoming the fastest app in history to reach 100 million users. ChatGPT got technologists and investors seeing dollar signs. ChatGPT wrapper apps began filling app stores. People began selling “how to make money with ChatGPT” courses. Microsoft (MSFT) bought half of OpenAI, the new app’s developer, for $30 billion. Rosy forecasts of multi-trillion dollar productivity gains were given in newsrooms across the United States.
In some cases, the big investments in AI paid off. NVIDIA (NVDA), for example, compounded its earnings at nearly 100% for three full years after the AI spending spree started. But for the companies buying NVIDIA’s chips, the story was different. Google’s free cash flow per share declined below 2021 levels. Microsoft’s FCF increased in the same period, but only slightly. It was a similar story with Apple (AAPL), although you could argue that AI CAPEX spend was not a big factor for that company in the 2021-2023 period, as it only launched its AI services this year. Meta actually saw substantial FCF growth over the last three years, but for reasons unrelated to AI: the company said it would take years for its AI investments to pay off.
So, we have big tech stocks as a class trading near all-time highs, while not seeing much growth from the big catalyst that got investors excited about them in late 2022. For this reason, I would be selling the QQQ today if I owned it.
The Valuation: Extreme
According to various data sources, the Invesco QQQ Trust is among the most expensive ETFs in the world. By “expensive” I mean that its components are richly valued, not that the fund itself charges high fees (its 0.20% MER is actually rather low).
We can approach the QQQ’s valuation using various data sources. First, let’s take a look at Invesco’s own data. According to Invesco’s most recent fact sheet, QQQ trades at 38.88 times earnings and 16.65 times book. Barron’s says that the NASDAQ-100 trades at 30.75 times earnings. Bloomberg has the index at 32.88 times earnings, 7.7 times book and five times sales. So we have a P/E range of 30.75 times earnings and 38.88 times earnings for the QQQ and/or the NASDAQ-100 index (the index the QQQ is built on).
Since there’s quite a bit of variance in these estimates, I will take a look at the holdings individually. I’ve computed average P/E ratios for these stocks in past QQQ articles, using a simple arithmetic average. This time around, I’ll weight each P/E ratio, to give an average P/E estimate that’s more faithful to the fund’s market cap weighting-a massive improvement over my previous methodology.
Below, you can see a list of the top 10 QQQ holdings by weight. These holdings collectively are weighted at 49.51% of the fund, which means that by multiplying each weighting by 2.0197 we can get a weighted average P/E for the top 10 stocks specifically.
QQQ Holdings (Invesco)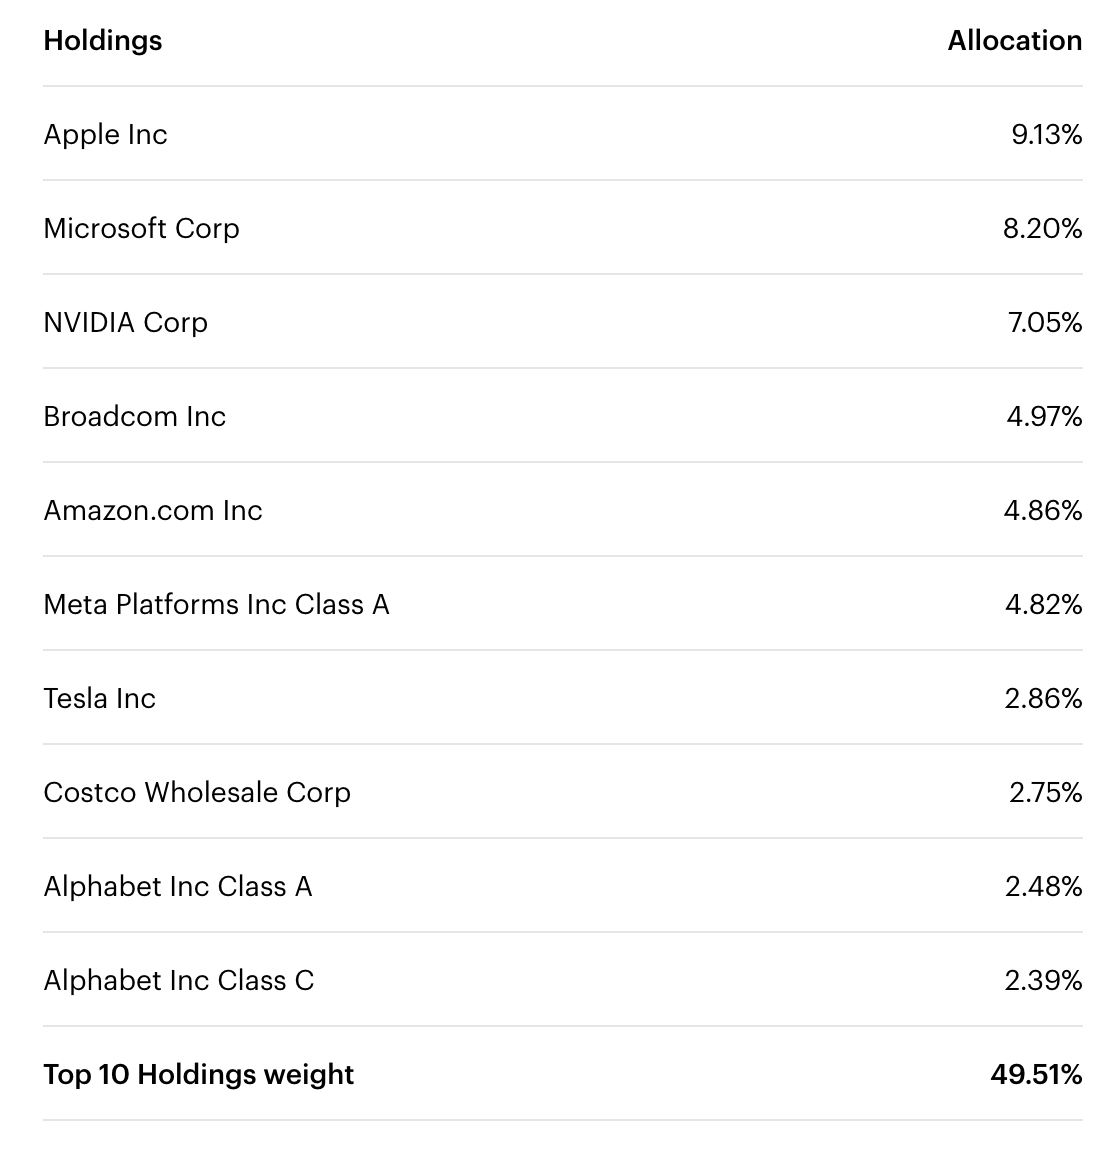
Here are the QQQ’s top 10 stocks, their (adjusted) P/E ratios, adjusted weightings and weighted average P/E ratio. The data sources for this table include Seeking Alpha Quant multiples and Invesco’s holdings sheet.
|
STOCK |
P/E |
WEIGHT * 2.0197 |
WEIGHTED P/E |
|
Apple |
33.6 |
0.18439861 |
6.195793296 |
|
Microsoft |
34 |
0.1656154 |
5.6309236 |
|
NVIDIA |
46.5 |
0.14238885 |
6.621081525 |
|
Broadcom (AVGO) |
30 |
0.10037909 |
3.0113727 |
|
Amazon (AMZN) |
41 |
0.0982 |
4.02445422 |
|
Meta Platforms |
25.5 |
0.0973 |
2.48241327 |
|
Tesla (TSLA) |
90 |
0.0578 |
5.1987078 |
|
Costco (COST) |
55 |
5.55% |
3.05479625 |
|
Google ‘A’ |
21.7 |
0.0501 |
1.086921752 |
|
Google ‘B’ |
21.8 |
4.83% |
1.052304094 |
|
10 STOCKS WEIGHTED AVERAGE P/E |
N/A |
.9999 |
38.35876851 |
As you can see, my weighted average methodology yields a 38.35 P/E for the top 10 QQQ components, almost identical to what Invesco itself reports. So, the QQQ’s top components are very expensive.
Growth
Now, a QQQ bull might look at the table above and think something along the lines of “sure, the QQQ stocks are expensive, but they are also growth stocks, so higher than average multiples are justified.” This is true of some of them, but not true of all of them.
Examples of QQQ stocks with decelerating growth include:
-
Tesla (revenue up just 1.37% LTM).
-
Apple (revenue up 0.45% and FCF down 6.4% LTM).
-
Google (free cash flow lower than in 2021 despite rising revenue).
These companies do have decent growth rates if you zoom out to the three or five-year periods. However, there is reason to think that some of them will have a hard time getting their growth back. As of the most recent reports, the U.S. economy grew at 3% in the second quarter, yet we have Tesla and Apple growing their top lines less than 2%. These companies are growing less than the economy is-at least their sales are. Why is it that their growth has slowed so much?
In Tesla’s case, competition appears to be the culprit. The days of TSLA being the only EV game in town are over: there are 39 publicly traded EV companies in the world right now, and while tariffs are keeping the Chinese EV makers off Tesla’s turf, companies like Volkswagen (OTCPK:VWAGY) bringing competition in the U.S. and Europe.
In Apple’s case, the company’s sheer scale has become a problem. Apple did $101 billion in net income last year. If the company launched a new product that did $5 billion a year in profit, that profit would only move the needle for the company by 4.95%. Yet by most other companies’ standards, a $5 billion a year product is a huge success. It’s not clear what new product categories Apple can move into to ramp up its growth. $10 billion a year ideas are few and far between. Probably incremental growth from price hikes and mild share gains are the best shareholders can hope for here. So, Apple’s rich valuation appears unjustified relative to the company’s growth prospects.
The Bottom Line
There’s no doubt in my mind that the Invesco QQQ Trust is a buy at some price. The fund has great characteristics, such as a 0.2% MER, massive trading volume, and a miniscule 0.02% bid-ask spread. These characteristics make QQQ a great trading security. However, the fund’s holdings are so richly valued right now that it’s hard to imagine how a buy today could pay off in the near term.
Editor’s Note: This article discusses one or more securities that do not trade on a major U.S. exchange. Please be aware of the risks associated with these stocks.
Credit: Source link


