


Michael M. Santiago
Thesis
The Dogs of the Dow strategy is a stock-picking strategy that involves buying the 10 stocks in the Dow Jones Industrial Average with the highest dividend yields. This strategy has historically outperformed the market over the long term (as detailed in the second section).
Currently, Goldman Sachs (NYSE:GS) has become a member of the Dogs. As seen in the chart below, it is yielding 3.54% based on the estimated dividend for next year and ranked the 8th highest-yielding stock in the Dow 30 index based on this. This is a bit unusual, as banks typically do not have the highest dividend yields. The highest yields are typically provided by utility-type stocks like Verizon (VZ), basic material stocks like Dow Inc. (DOW), or healthcare stocks like Walgreens (WBA).
I view the recent turmoil in the banking industry as the main reason for this unusual situation. GS stock has been impacted by the recent turmoil, which is an overaction, in my view. It is a leading investment bank with well-diversified revenue sources and a strong track record of profitability. Instead, I see the recent price volatility as an opportunity. As to be elaborated later, the market overaction could offer an entry price to buy GS shares at book value or even tangible book value.
indexarb.com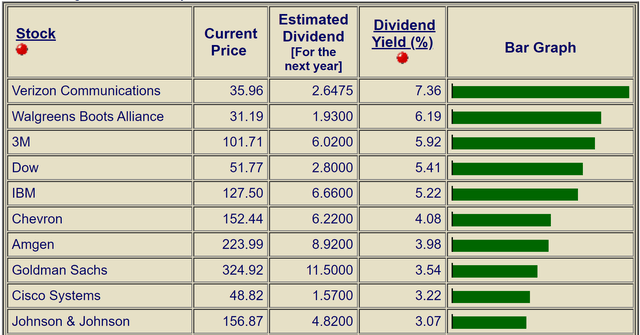
The Dog of The Dow method and how did it perform?
Readers familiar with the Dog of the Dow strategy can skip this section entirely. The contents in this section are largely taken from my previous articles. To recap, the strategy involves:
- Selecting several (say 10) stocks that have the highest dividend yield from the Dow Jones Industrial Index
- Holding them for a period of time (say 1 year)
- Repeating (or balancing) based on steps 1 and 2
It’s a proven way to systematically invest in undervalued and prominent dividend stocks as shown by historical data. According to Investopedia:
The chart compares the strategy to simply holding the Dow Jones Industrial index (“DJIA”). As seen, the strategy lagged the DJIA after the 2008 crash till 2010. Then it recovered and has been outperforming DJIA consistently since then. According to Investopedia.com, $10,000 invested in DJIA from the beginning of 2008 would grow to $17,350 in 2018. While the Dogs of the Dow strategy would have grown to $21,420.
Investopedia
GS’s yield contextualized by the Dow Index
To contextualize how attractive GS is under current conditions, the next plot compares its yield against that from the Dow index (approximately by the DIA ETF).
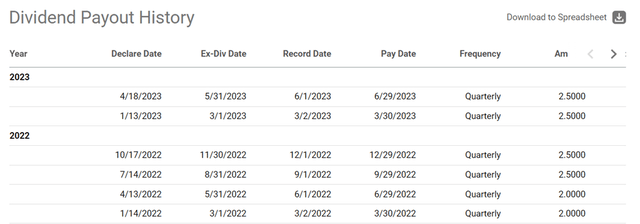
As seen, it offers very attractive dividend yields. Its dividend yield is not only substantially above the index but also substantially above its own historical average. To wit, its 4-year dividend yield is 2.07%. As such, its estimated FWD yield of 3.54% (as quoted in the first chart above) is potentially a whopping 71% above this average, signaling a substantial valuation discount. Note the chart below quoted a TTM yield of 2.92% probably due to a delayed update of its recent dividend payout of $2.5 in April 2023. As shown in the next chart below, its TTM payout is $10 as of April 18, 2023, translating into a TTM yield of 3.07% at the stock price of this writing ($324). In contrast, DIA’s current yield of 1.96% is almost exactly on-par with its historical average of 1.94%, signaling that the overall index is fairly valued.
Seeking Alpha data Seeking Alpha data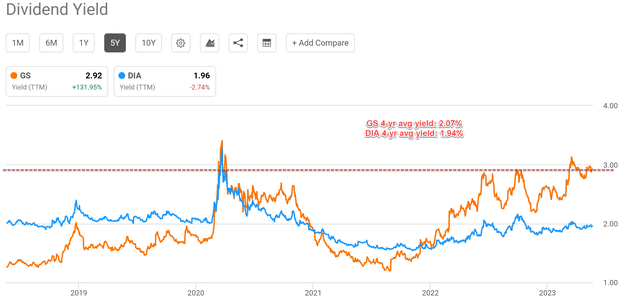
Buying good banks at book value
Buying good banks like GS at or near book value has been a successful investment strategy in the past for us. And buying good banks at or near tangible book value (‘TBV’) is a no-brainer for us. TBV measures the company’s tangible assets minus its total liabilities, and therefore, is a really conservative measure of a company’s net value.
GS has been growing its BV and TBV with great consistency in the long term, as shown in the chart below. Its TBV has grown by an average of ~4%+ per year over the past decade. In 2013, the company’s TBV was about $65B. And as of the most recent quarter, it had grown to more than $98B. This growth has been driven by a number of factors, including strong earnings growth, share repurchases, and the acquisition of other companies.
Looking forward, I don’t see any of these drivers changing in any fundamental way. Again, I view the fears triggered by problematic banks (like the SVB financial group and even the struggling Credit Suisse Group AG) as an overaction in the case of GS. Its business fundamentals are fundamentally sound, and my research did not reveal any substantial exposure of GS to these banks. Most of the problems are with smaller and regional lenders, not with leading banks like GS. Plus, even for these troubled smaller banks, the announced support from President Biden’s office, the Fed, and the Federal Deposit Insurance Corporation (FDIC) are sufficient to contain the problem as I see it.
Seeking Alpha data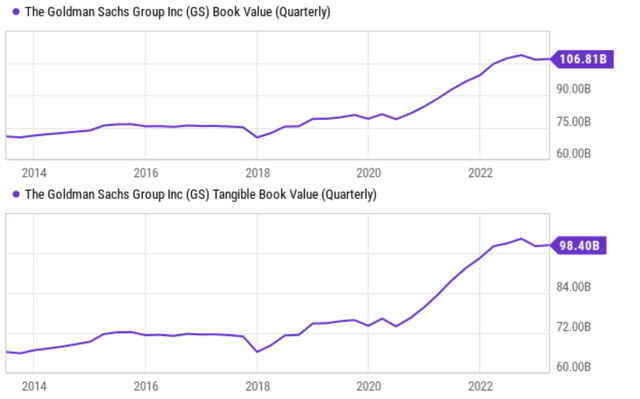
Nonetheless, the price volatility caused by such turmoil has compressed GS’s valuation so that now it trades close to its BV as seen in the top panel of the chart below. To wit, the stock currently is priced at only 1.018x of its BV (i.e., within 2% of its BV). Furthermore, as seen in the bottom panel of the chart, in terms of TBV, the stock is now priced at only 1.10x its TBV. Recent volatility is large enough to move its stock prices by about 10% on a monthly basis. As such, it is very like that potential investors would have the opportunity to buy its shares at TBV in the next month or so.
Seeking Alpha data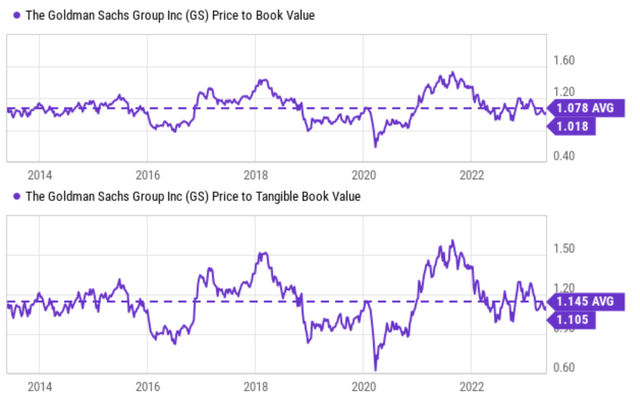
Risks and final thoughts
Although even if the problems with regional banks are completely contained, GS (together with the rest of the banking sector) still faces several other risks. High inflation, a softening housing market, and rising interest rates are among the top risks facing major lending institutions. Specific to the analysis presented above, it is important to note that GS’ BV and TBV themselves are moving targets. These numbers constantly change with market conditions. Given the scale and complexity of GS’ assets, it is simply infeasible to get a timely and accurate estimate. And hence, the announced BV and TBV (like those quoted by YCharts above) are always delayed and could contain inaccuracies.
The above uncertainties are precisely the reason to always invest with a wide margin of safety. And to conclude, judging by its current dividend yields, especially under the context of its historical average and the Dow index, my view is the current margin of safety is wide enough already. And in the case its price fluctuates further closer to its latest TBV, our experiences have shown winning odds despite the uncertainties and delays embedded in the TBV.
Credit: Source link


