


adventtr/iStock via Getty Images
Overview
FS KKR Capital (NYSE:FSK) operates as a business development company that invests in upper middle companies through different forms of debt such as lending or equity investments. I previously covered FSK back in early April, and the performance since then has outpaced the S&P 500 (SPY) due to the consistently high levels of distribution. FSK currently has a dividend yield of 13% which makes it highly appealing to investors looking to add high levels of income to their portfolio. We can see that FSK outperforms the VanEck Vectors BDC Income ETF (BIZD) as well.
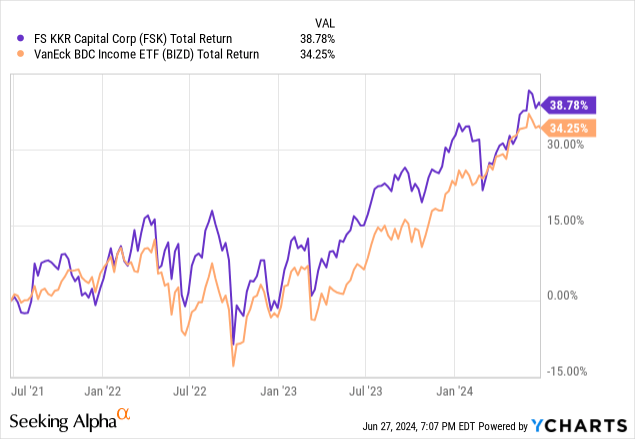
FSK has a total return profile of nearly 39% over the last three-year period, which is a testament to its quality and consistency. A lot of the growth can be attributed to the prolonged period of higher interest rates. As interest rates rose, so did the earnings potential for this BDC, as the majority of their investments are done on a floating rate basis. However, the rise of interest rates have also revealed some weaknesses in the underlying quality of underwriting of their investments. This is the reason why I rated FSK as a hold the last time I covered it. I wanted to revisit now that we are at the midpoint of the year and provide some updated insights where possible.
I previously rated FSK as a Hold during my last coverage, but I see signs of improvement with the portfolio structure and quality, which are contributing to my upgraded rating. Most importantly, non-accruals have decreased as a result of some portfolio weight shifts and increased investment activity. Let’s first take a look at the strategy FSK uses to generate the income needed to support its high distribution rate.
Slight Portfolio Improvement
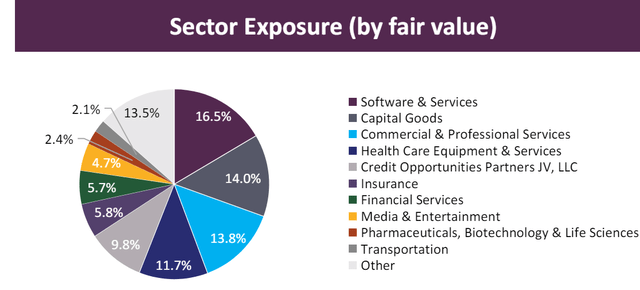
A part of FSK’s approach is to remain highly diverse in order to eliminate any sort of concentration risk to any one specific industry or sector. We can see that the majority of FSK’s investments are within the software and services sector, accounting for 16.5% of the fund’s fair value. This means that FSK leans more towards technology-based companies and may experience more price upside during tech bull runs. This is closely followed by exposure to capital goods and commercial & professional services, making up 14% and 13.8% of fair value respectively.
The structure and exposure make up of their investments remain mostly the same from the last time I covered FSK. Software & Service exposure was slightly reduced from the prior level of 16.9%. When I last covered FSK, they had a small 2% weight in equity real estate investment trusts, but this has since been reduced and is no longer included in FSK’s top sector breakdown. Their portfolio of investments has a fair value of $14.2B and about 205 different portfolio companies within.
FSK Q1 Presentation
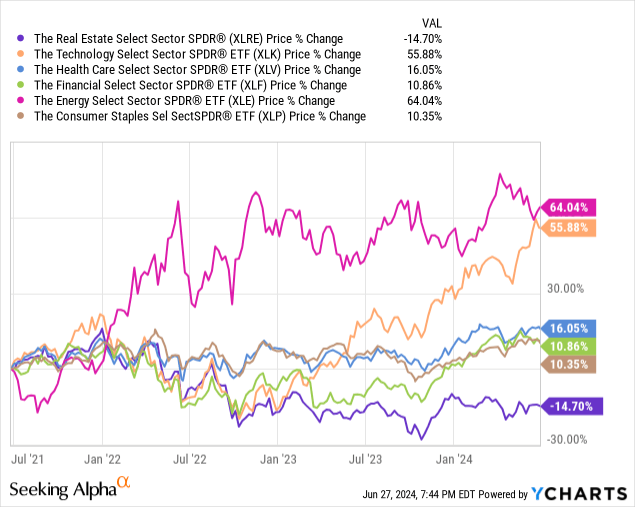
Despite the original exposure to REITs being small, I still believe this to be an improvement. Real estate was the hardest-hit sector as a result of rising interest rates and still hasn’t quite recovered. Just to give you an idea of how impacted the real estate sector (XLRE), take a look at the quick price performance comparison below. Real estate still remains in the negative compared to all of the other sectors. This is likely due to the sector’s reliance on access to affordable debt financing that can go towards acquisitions, expansion efforts, and new project developments as a way to fuel growth.
However, the investment strategy of FSK is pretty solid with a majority focus on senior secured debt investments. Approximately 65.2% of their investments are senior secured, and this offers a bit of security since senior secured debt sits at the top of the capital structure. This form of debt has the highest repayment priority before others in scenarios where a portfolio company may be going through a bankruptcy and liquidating assets. This helps protect against bad investments so that FSK can get some capital back instead of losing everything.
Financials & Risk Profile
FSK reported their Q1 earning at the start of May and the results were mostly positive. Net investment income landed at $0.73 per share, while total investment income amounted to $434M. While total investment income was actually down 4.8% year over year, the NII per share performance was solid and aligned with Q1 results of prior years. What stood out the most during this latest quarterly report was the elevated levels of new investments that FSK made.
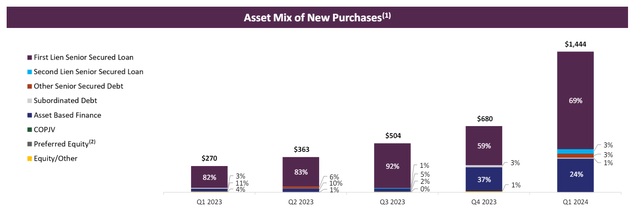
About 75% of these new investments were allocated towards add-on financing to existing portfolio companies, since those relationships are already established and expectations are clear. The remaining percentage went towards new investments that may be able to contribute additional growth to their overall portfolio. These new originations stuck with their strategy by maintaining a 69% exposure to first lien senior secured loans. These new investments had a weighted average EBITDA of $243M and a 5.7x leverage rate.
FSK Q1 Presentation
The last time I covered FSK, the effects of the higher interest rates started to reveal that some of FSK’s investments may not have been high quality. At the time, the rate of non-accruals sat at 8.9% of the amortized cost of the total portfolio. This non-accrual rate has been improved and has now decreased to 6.5% at cost basis and 4.2% of fair value. This improvement is through a lower exposure to interest rate sensitive sectors like real estate and an increased level of new investments. The new investment growth has steadily risen now for a year straight, and the improvements are now being seen as FSK successfully adapts to the higher interest rate environment. Just as a reference, here are the non-accrual rates of some peer BDCs:
- Ares Capital (ARCC): 1.7% non-accrual rate at cost.
- Fidus Investment (FDUS): 1% non-accrual rate at fair value.
- Capital Southwest (CSWC): 2.3% at fair value.
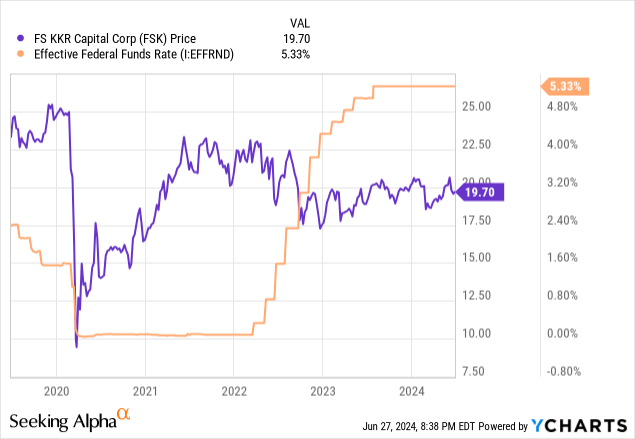
We can see that FSK and the federal funds rate share an inverse relationship. As interest rates rise, the level of NII (net interest income) rises due to the floating rate structure. The percentage of investments that are on a floating rate basis now sits slightly above 90% as of the latest Q1 report. This has helped FSK capture a much higher level of NII per share as rates increased. However, this also meant that non-accruals naturally increased as it put additional strain on the profitability on some portfolio companies. However, it seems like FSK has become accustomed to the rate environment and with the elevated levels of new investment activity, we may see non-accruals continue to decrease.
We sit in a bit of a uncertain spot because on one end, FSK has adapted to the higher interest rate environment and increased the quality of their portfolio. However, there are some indicators that point to interest rate cuts being on the horizon. Inflation has slowly started to cool and creeps closer to that 3% mark. Additionally, the unemployment rate has consistently crept up over the last few quarters and now sits at the 4% mark as the labor market weakens. Lastly, the US Presidential elections are at the tail end of the year and this may cause elevated levels of uncertainty in the markets. A combination of all of these factors may be enough of an incentive for the Fed to begin cutting rates. If rates start to get cut, we may see lower levels of NII per share, but this isn’t the end of the world because lower interest rates would likely translate to a higher volume of potential borrowers that can offset any drop in earnings.
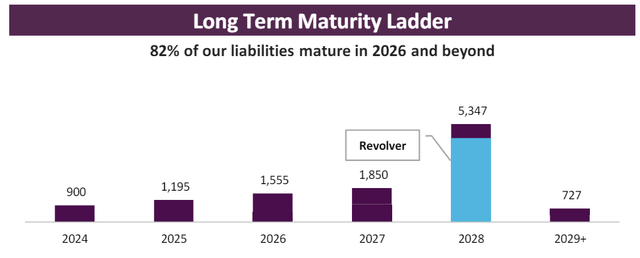
Lastly, the liquidity of FSK remains strong despite the non-accruals and elevated level of capital committed to new investments. FSK currently has $242M in cash and equivalents to help them navigate any additional headwinds. This cash is accompanied by over $3.6B in financing arrangements and credit availability. This level of liquidity is strong when considering that most of their debt maturities take place in 2026 and beyond.
FSK Q1 Presentation
Dividends
As of the latest declared quarterly dividend of $0.64 per share, the current dividend yield sits at 13%. At the beginning of May FSK announced both a special dividend and a supplemental dividend so shareholders have been handsomely rewarded with extra income. The first supplemental distribution of $0.06 per share will be paid alongside the base distribution. The second supplemental of $0.05 per share was paid out at the end of May. The additional supplementals reinforce that FSK is successfully generating high levels of income.
What amazes me about these supplementals is that FSK is externally managed by FS KKR Advisors. These high levels of supplementals are more common when looking at internally managed business development companies. This is because internally managed BDCs don’t have to dish out a slice of their earnings to pay the management’s fee. However, FSK is able to perform at this high caliber while being externally managed and the base distribution remains well-supported.
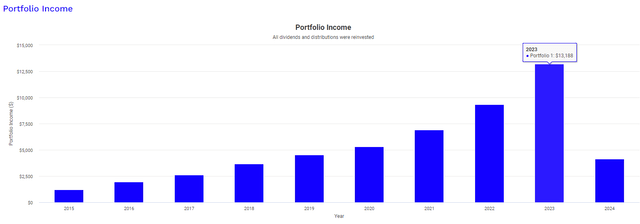
As previously mentioned, NII landed at $0.73 per share for Q1. This means that the quarterly dividend of $0.64 is supported at a coverage rate of 114%. This means that as long as rate remain elevated, I believe that the dividend should remain at the current levels. This high yield produces an impactful income stream that can grow to high levels over time with continued investment. Running a back test with Portfolio Visualizer, we can create a visualization of how an investment of $10,000 would have played out. This assumes that the $10,000 investment was made at the start of 2015 and an additional $500 was invested every single month. Additionally, the calculation also assumes that all dividends received were reinvested back into FSK.
Portfolio Visualizer
In 2015, the dividend income received from FSK was $1,228. Fast forward to the full year of 2023 and the dividend income produced from your investment would now equal $13,188. This shows the insane compounding power of a high yielding BDC like FSK. Keep in mind that throughout the last decade, the interest rate environment has shifted back and forth and FSK has still managed to compound the dividend income at a relatively consistent rate over the last decade.
Valuation
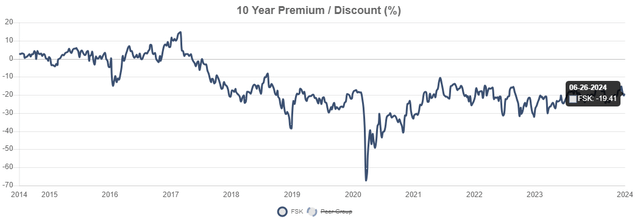
In terms of valuation, FSK still trades below its pre-pandemic level and never quite fully recovered back to the $23 per share range after the covid related drop. A quick reference to the average Wall St. price target of $20.65 reveals that there’s a potential upside of about 5% from the current levels. Since FSK operates as a BDC, the price can significantly vary from the underlying value of assets. As a result, FSK trades at a large discount to net asset value of about 19%. For reference, the price has traded at an average discount to NAV of 21% over the last three-year period.
CEF Data
However, the average discount to NAV level is more representative of the higher non-accrual rates at the time. Now that non-accruals has started to decrease and the shape of the portfolio improves through its decreased exposure to real estate and increased investment activity, I believe that the price of FSK may actually grow over time. Even if interest rates end up getting cut, FSK may increase in price and NAV and lower rates would likely serve as an incentive to a higher volume of borrowers for FSK to invest in. As a result, I am upgrading my rating to a Buy.
Takeaway
In conclusion, I am happy to see that FSK’s portfolio and non-accruals have improved over the last quarter. The poor non-accrual rate is what initially prompted my hold rating, and it’s clear that management is trying to improve. The increased level of investments has the potential to yield higher levels of net investment income going forward. This is even more likely if we consider that lower interest rates may actually increase the volume of potential borrowers that FSK can invest in. FSK has maintained a well-balanced and diverse portfolio that has exposure across many different industries. NII per share covers the distribution at a comfortable margin and therefore gives confidence that the distribution remains safe in the current environment.
Credit: Source link


