


Alistair Berg/DigitalVision via Getty Images
Why This Is Interesting
In a research article published last month about General Mills, I observed significant outperformance of GIS versus the S&P 500 since a successful previous Buy rating in June. However, I argued that individual stock news was unlikely to have driven this outperformance. Instead, increased market volatility and an S&P 500 drawdown were the key factors, during which GIS played out its anti-correlation and risk-hedge role in the short term. GIS rose sharply alongside an increasing VIX, a falling CNN Fear & Greed Index, and a declining S&P 500. Rightfully, the community quickly raised the question of how these correlations hold up over the longer term.
With this research piece, I will further expand my observations, not only in terms of time but also in the breadth of stocks, to 16 representatives of the Food & Beverage sector as well as the Invesco Food & Beverage ETF (PBJ). I will determine Beta factors and correlations against the S&P 500 and the VIX. The results will indicate if and which stocks were particularly effective hedges against volatile S&P 500 exposure.
Research Design
- Monthly data points from 2005-07 to 2024-08.
- For stock selection, I screened on dividendstocks.cash using the sectors “Beverages” and “Food Products” and filtered for companies with a market cap of at least $25 billion. Many of these are also included in the Invesco Food & Beverage ETF. Observed stock tickers in alphabetical order were:
|
ADM |
Archer-Daniels-Midland Company |
|
BUD |
Anheuser-Busch InBev |
|
DANOY |
Danone |
|
DEO |
Diageo |
|
GIS |
General Mills |
|
HSY |
The Hershey Company |
|
K |
Kellanova |
|
KDP |
Keurig Dr Pepper |
|
KHC |
The Kraft Heinz Company |
|
KO |
The Coca-Cola Company |
|
MDLZ |
Mondelez International |
|
MNST |
Monster Beverage Corporation |
|
NSRGY |
Nestlé |
|
PEP |
PepsiCo |
|
PRNDY |
Pernod Ricard |
|
STZ |
Constellation Brands |
- Calculated metrics:
- Beta vs. S&P 500 over the entire period
- Beta vs. S&P 500 over 5 years
- Pearson correlation of returns vs. S&P 500 over the entire period
- Pearson correlation of returns vs. S&P 500 over 5 years
- Pearson correlation of returns vs. VIX over 5 years
- Since the use of the Pearson correlation coefficient in this context is often considered a fallacy in scientific discourse and the Spearman coefficient might be preferred, I also considered Spearman for all observed values and found no significant changes to the core conclusions.
- Be aware of listing details displayed in my charts (ADR, OTC) indicating that for example FX effects may influence the metrics, e.g., for stocks not primarily listed in the U.S.
- Data back to 2005-07 was not available for all stocks. In these cases, the evaluations go back as far as data was available.
- This research observes historical data in isolation, i.e., without considering other highly important factors such as valuation, the overall state of the economy, or monetary policy. These are clear limitations of this research article.
- While great care has been applied in data analysis, this article is not intended to be viewed as a comprehensive scientific paper.
F&B Stocks With Lowest Beta Factors
See below all data sorted from the lowest to highest Beta against the S&P 500 over approximately 19 years. Next to it, the 5-year Beta is also displayed, which, as indicated by the color coding, largely follows a similar order. General Mills, with a Beta factor of 0.25 over 19 years and 0.09 over 5 years, is the most decoupled from the S&P 500, followed by Hershey and Kellanova. The PBJ ETF, with Beta factors of 0.66 and 0.62, is positioned in the middle range. Beverage companies like Anheuser-Busch InBev, Constellation Brands, and KDP, some of which I have already covered, rank among those with the highest long-term 19-year Beta factors. Please also refer to the 5-year metrics next to these figures.
Author | Data: investing.com, Invesco, dividendstocks.cash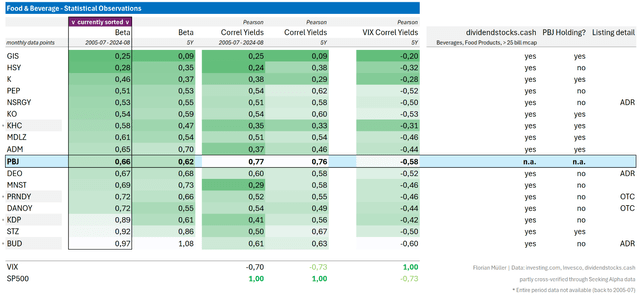
Most Uncorrelated From The S&P 500
Even with this next metric, the correlation coefficient, over the last 19 years, General Mills and Hershey show the lowest values against the S&P 500, indicating very weak correlations. Interestingly, the F&B ETF shows the highest correlation, at 0.77 over 19 years and 0.76 over 5 years, suggesting that this ETF would not have effectively counteracted S&P 500 movements. Also, note at the very bottom that the VIX is highly negatively correlated with the S&P 500, at -0.70 or -0.73, indicating that rising volatility generally accompanies market downturns.
Author | Data: investing.com, Invesco, dividendstocks.cash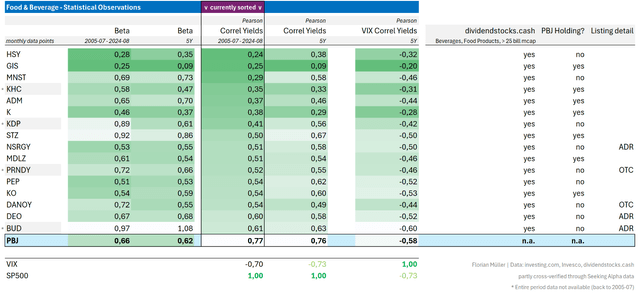
F&B Is Not The Same As F&B – Not All F&B Stocks Hedge The Same Against Volatility
One thing becomes immediately clear – not a single one of the shown stocks managed to completely escape this negative correlation with the VIX over the past 5 years. In other words, all stocks exhibit a negative correlation with the VIX. As volatility increases, all stocks tend to fall. While the S&P 500 shows the strongest correlation at -0.73, the F&B ETF performs significantly better at -0.58. Every individual F&B stock also shows a weaker correlation than the overall S&P 500. General Mills stands out once again, with the lowest negative correlation to the VIX at -0.2. Among all the F&B stocks analyzed, GIS was the best at hedging against rising volatility, as it was the least affected by falling prices when the VIX increased.
Author | Data: investing.com, Invesco, dividendstocks.cash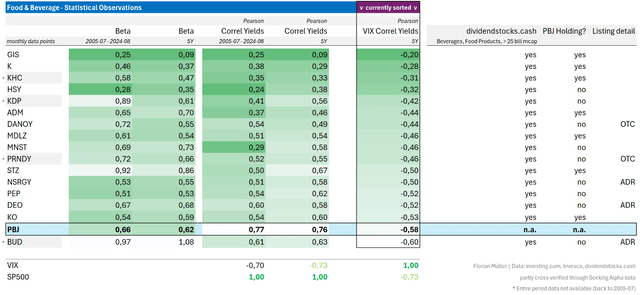
Takeaway
Never make investment decisions solely based on historical (anti)correlations and similar factors, which is the focus of this research article. For me, the fundamental analysis of the company itself always comes first. For example, the fact that GIS apparently shows a historically reliable detachment from the S&P 500, as well as a noticeable independence from the VIX, and thus seems to be a particularly strong stabilizing factor against volatility and downturns, is an additional feature, and not the decisive point. Moreover, F&B is not all the same, as the observed beverage stocks, in particular, historically showed less independent hedging potential. The Invesco Food & Beverage ETF as a whole is also not the best choice if the goal is counterpositioning against volatility and downturns. In an ETF or index, the advantages of individual stocks get diluted, which is especially unhelpful when one’s portfolio is based on single-stock investments. In such cases, the individual stock matters more than the entire sector.
I therefore rate this PBJ ETF, as well as the S&P 500, as a neutral Hold and prefer picking individual stocks that best match personal risk preferences at appropriate valuations.
Credit: Source link


