AlbertPego
Background
I identified Cheniere Energy Partners, L.P., (NYSE:CQP) as an outperformer in a recently published analysis entitled Let’s Talk About The Dividend Kings’ Midstream Cousins. In that analysis, 8 midstream companies with a forward yield of at least 5% and at least 5 years of distribution growth were identified. This analysis will look closely at CQP’s outlook, distribution history, past returns, and distribution coverage ratio.
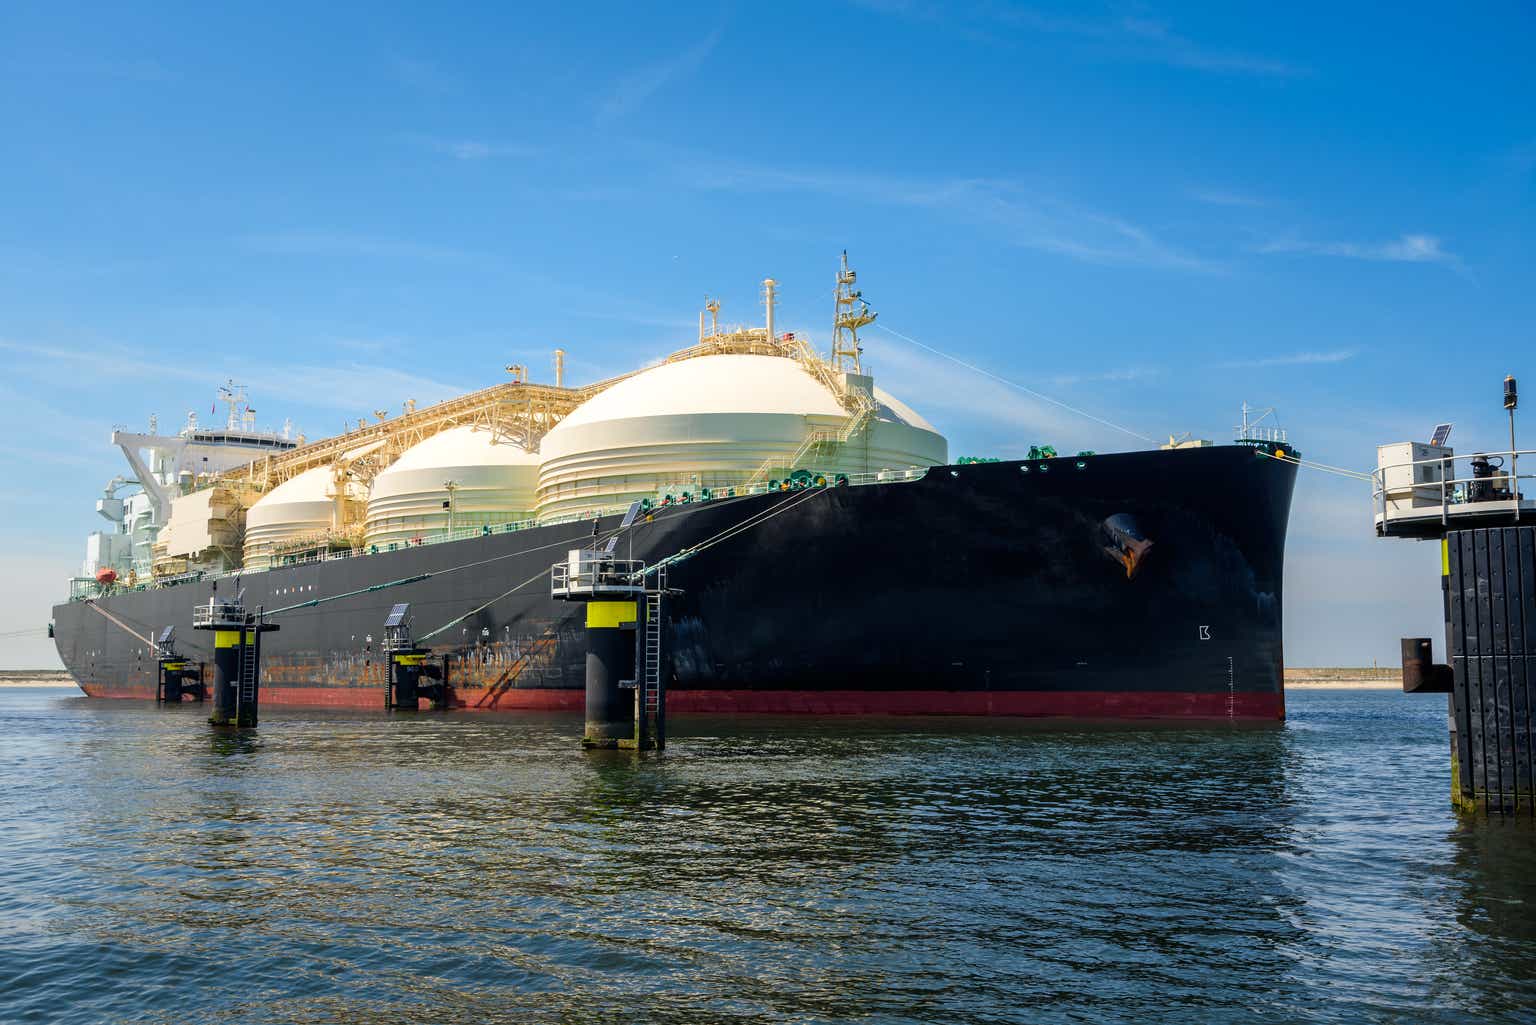
CQP is a unique company within the midstream space. Its primary operations are natural gas liquefaction and export as opposed to oil and gas pipelines or storage. CQP operates as a subsidiary of Cheniere Energy, Inc (LNG), one of the pioneers in liquid natural gas export. CQP’s FY 22 earnings and revenue reached an all-time high on record natural gas exports to Europe and globally.
CQP’s Unique Global Exposure
CQP is uniquely exposed to global energy markets, especially the European natural gas market. According to recent news from U.S. EIA, this year’s record profits are probably not repeatable.

U.S. EIA
Europe ended its high demand heating season with the highest levels of natural gas storage on record. CQP is likely to see less European demand for LNG this year based on these data.
Distribution History
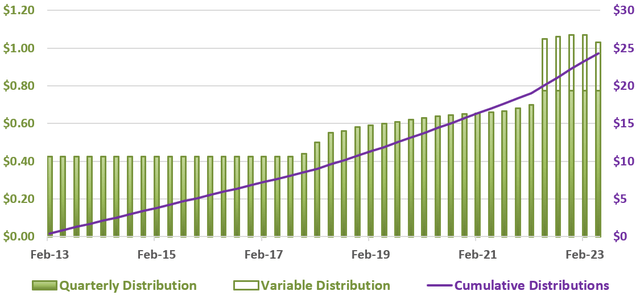
Readers are advised CQP is Master Limited Partnership (MLP) and its distribution payments confer unique tax benefits and considerations. MLPs are required to distribute all earnings beyond those needed for current operations to unit holders. CQP has consistently paid a quarterly distribution since 2007; the most recent 10 years of distribution history is detailed in the plot below.
CQP Distribution History: 2013 Forward
Author, SA Data
Quarterly distributions (solid green columns) have increased 83% from $0.425 in 2013 to $0.775 most recently. With recent record cash flow, CQP paid five additional variable dividends totaling between $0.275 and $0.295.
Although the additional variable distributions were welcomed over the last several quarters, investors should not assume additional variable dividends will continue. In fact, CQP most recently announced its next quarterly dividend of $0.775 while reducing the variable dividend to $0.255.
CQP Returns: 2013 Forward
Author, SA Data
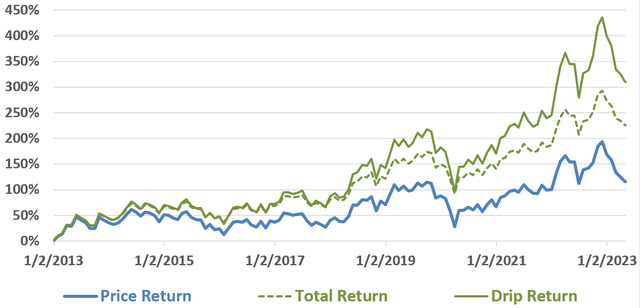
Over 10 years, CQP return with dividends reinvested (drip return – green line) was over 300% vs SP500 total return of about 240%. Total return with dividends set aside was well over 200% while price return was about 115%.
Are CQP Distributions Safe?
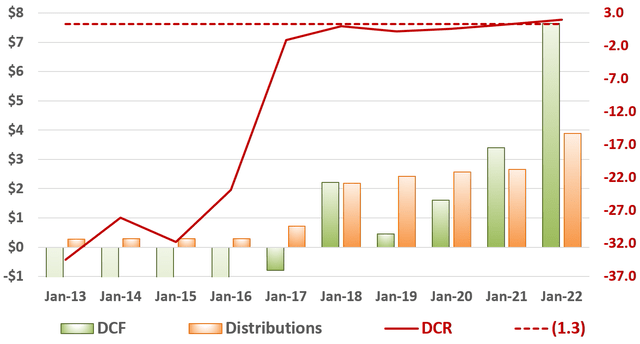
Rather than payout ratio, MLP distribution safety is most commonly measured with distribution coverage ratio (distributable cash flow / distribution). MLPs often calculate distributable cash flow (DCF) in different ways with a resulting coverage ratio of 1.5 often considered sustainable. However, in order to compare distribution coverage ratio (DCR) between MLPs, a general and more rigorous definition of DCF is required. For this reason, DCF was defined as DCF = cash from operations – total CapEx in this analysis.
Distribution Coverage Ratio: 2013 Forward
Author, SA Data
When DCF is defined as cash from operations – total CapEx, a distribution coverage ratio of at least 1.3 (dashed red line) is considered sustainable. For most of the last ten years, CQP’s distribution coverage ratio has been well below the 1.3 minimum. However, over the last two years distribution coverage ratio has averaged 1.62. It appears as though the quarterly distribution is currently well supported by cash flows and may have room to grow.
CQP Fairly Valued?
Notably, CQP is difficult to evaluate because it operations are dissimilar to other energy midstream companies. Therefore, relative valuations based on the average PE ratio of two different peer groups was calculated.
CQP Share Price Estimate

Author, SA Data
The first group was the seven peers identified in my previous analysis, Let’s Talk About The Dividend Kings’ Midstream Cousins. Based on this group’s average PE and CQP estimated FY 23 earnings, share value was estimated at $59.84 suggesting over 30% upside vs its current share price.
However, this peer group may not be appropriate as CQP operations are natural gas liquefaction and export as opposed to oil and gas pipelines and storage. Therefore an additional valuation was calculated based on average PE ratio of seven peers whose operations are centered around liquid natural gas and liquid petroleum gas.

Author, SA Data
Based on peers’ average PE and CQP estimated FY 23 earnings, share value was estimated at only $33.54, suggesting about 30% downside from current share price. Notably, this peer group is also less than ideal as CQP operations remain unique.
Lastly, PE and other valuation ratios are calculated from empirical data but remain a reflection of market sentiment. PE ratios can expand or contract when market sentiment shifts in favor or against a given industry or company. It is difficult to predict how the market will value CQP going forward.
Risks
Falling North America natural gas prices are a tailwind for CQP because revenues are generated by global exports. However, investors should not assume sufficient global demand for North American natural gas.
Natural Gas Futures
Seeking Alpha
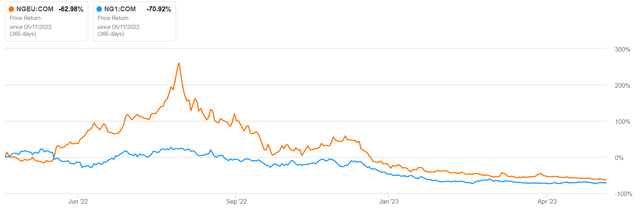
European natural gas futures (NGEU:COM) are plotted alongside North American natural gas futures (NG1:COM). Last year, European natural gas buyers were eager to replace Russian natural gas supply and the spread between North American and European natural gas reached record levels. With a mild winter and record spring storage levels in Europe, that spread has narrowed dramatically. I would advise investors continue to monitor European storage levels as peak summer demand approaches.
Conclusions
I would advise investors to closely examine reported distributable cash flow and distribution coverage ratios. In this analysis, distributable cash flow was defined as cash from operations – total CapEx with a 1.3 minimum safe value. Currently, CQP’s distribution appears sustainable with future growth possible based on a current coverage ratio above the generally accepted 1.3 threshold. However, future distributable cash flows remain dependent on natural gas price spread between North America and Europe and global natural gas demand.
Given the uncertainty in global natural gas markets, I would not rate CQP a buy at this time. However, CQP has been a great investment historically and its distribution appears safe. Optimistic investors might wish to look for a bargain around global natural gas demand uncertainty.
Right is not right; so is not so. If right were really right, it would differ so clearly from not right that there would be no need for argument. If so were really so, it would differ so clearly from not so that there would be no need for argument. – Zhuangzi
Credit: Source link


