Igor Kutyaev

Fasten Your Seatbelt
The script has flipped.
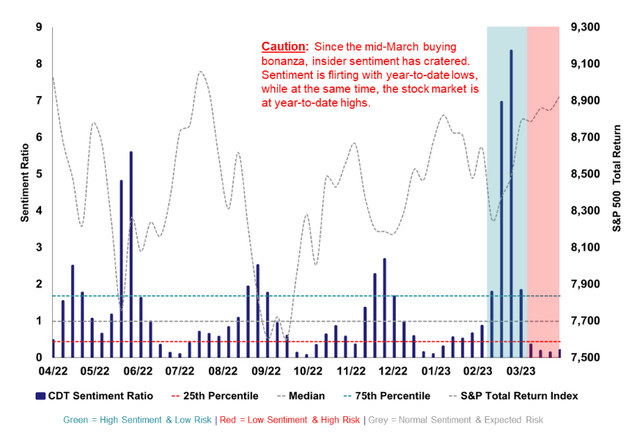
In mid-March, financial markets were in a mini tailspin. Jolted by the failure of several relatively large regional banks and the rescue of Credit Suisse (CS) in Europe, investors’ appetite for risk plummeted. At the depths of the volatility, the 10-year Treasury rate declined 60 basis points to 3.4% from 4% at the end of February, and the S&P 500 was down -3% while the SPDR S&P Regional Banking ETF (KRE) (a broad measure of regional bank stocks in the United States) declined by over -30%. In the face of the turmoil, insiders took a contrarian view. Despite growing concerns around the safety of the global banking system and the fragility of the macroeconomic environment, insiders aggressively purchased their own shares at levels well beyond their normal cadence. In hindsight, their positive outlook was validated, as markets have since rallied – the S&P 500 is up +8.1% since the March low.
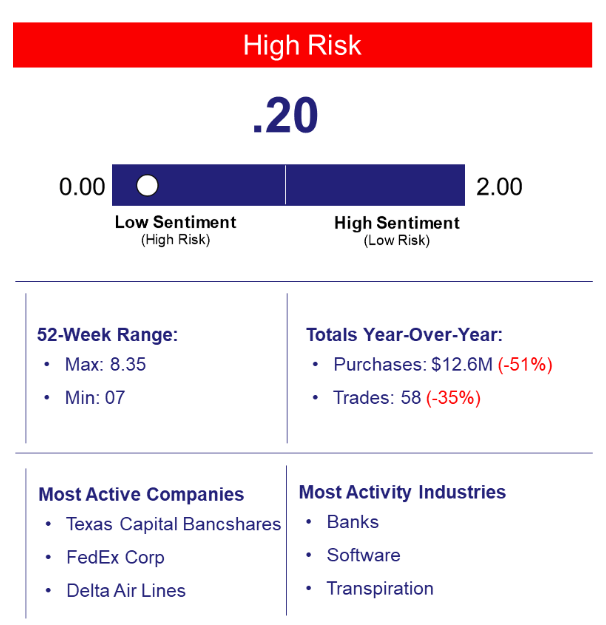
Exiting April, stock market and insider sentiment has switched. As fears of a burgeoning banking crisis have abated and securities markets have rallied, the stock market has entered what we describe as a euphoric state. Despite a laundry list of concerns including the catastrophic potential of a U.S. debt default (deadline estimated in June/July), markets remain defiantly positive. But market rallies in the face of large and looming concerns are fairly common throughout history; so much so that market participants have given this popular occurrence a phrase to describe this scenario – “the market is climbing a wall of worry.” The problem is that insiders are not climbing too. Once again, insiders are taking a contrarian perspective and hunkering down, with sentiment flirting with year-to-date lows just as the S&P 500 is at a year-to-date high. For us, this divergence gives us pause. With the obvious storm clouds ahead, it seems prudent to take a more conservative approach to risk given the uncertainties in the near-term outlook.
Expect turbulence ahead.
How it Works
Objective:
Predictive model that measures the historical relationship between insider sentiment and the future probability of downside volatility (risk).
Insider Trading Activity:
Purchase activity of an insider’s own stock filtered by proprietary parameters to scrub noisy data.
Insight:
Executive-level insider sentiment is an indicator of near-term financial market risk.
– Low executive sentiment suggests a high level of risk
– High executive sentiment suggests a low level of risk
Scale:
A ratio of current insider trading activity in relation to historical patterns.
– (0 to ∞) with a historical median measure of 1
– Below 1 implies an above normal level of risk
– Above 1 implies a below normal level of risk
Frequency:
The measure is updated daily and historically been subject to swift and possibly extreme shifts.
*This webpage is updated monthly and provides just a snapshot of the most recent month-end.
Disclosures
This presentation does not constitute investment advice or a recommendation. The publisher of this report, CDT Capital Management, LLC (“CDT”) is not a registered investment advisor. Additionally, the presentation does not constitute an offer to sell nor the solicitation of an offer to buy interests in CDT’s advised fund, CDT Capital VNAV, LLC (“The Fund”) or related entities and may not be relied upon in connection with the purchase or sale of any security. Any offer or solicitation of an offer to buy an interest in the Fund or related entities will only be made by means of delivery of a detailed Term Sheet, Amended and Restated Limited Liability Company Agreement and Subscription Agreement, which collectively contain a description of the material terms (including, without limitation, risk factors, conflicts of interest and fees and charges) relating to such investment and only in those jurisdictions where permitted by applicable law. You are cautioned against using this information as the basis for making a decision to purchase any security.
Certain information, opinions and statistical data relating to the industry and general market trends and conditions contained in this presentation were obtained or derived from third-party sources believed to be reliable, but CDT or related entities make any representation that such information is accurate or complete. You should not rely on this presentation as the basis upon which to make any investment decision. To the extent that you rely on this presentation in connection with any investment decision, you do so at your own risk. This presentation does not purport to be complete on any topic addressed. The information in this presentation is provided to you as of the date(s) indicated, and CDT intends to update the information after its distribution, even in the event that the information becomes materially inaccurate. Certain information contained in this presentation includes calculations or figures that have been prepared internally and have not been audited or verified by a third party. Use of different methods for preparing, calculating or presenting information may lead to different results, and such differences may be material.
Original Post
Editor’s Note: The summary bullets for this article were chosen by Seeking Alpha editors.
Credit: Source link


