


dk_photos
Earnings of Bridgewater Bancshares, Inc. (NASDAQ:BWB) will most probably decline this year due to pressure on the net interest margin. I’m expecting the company to report earnings of $1.35 per share for 2023, down 22% year-over-year. Compared to my last report on the company, I’ve reduced my earnings estimate because I’ve slashed my net interest margin estimate. The year-end target price suggests a small upside from the current market price. Hence, I’m downgrading Bridgewater Bancshares stock to a Hold rating.
Further Loan Growth Deceleration Anticipated
Bridgewater Bancshares’ loan growth slid to 3.2% in the first quarter from 5.6% in the fourth quarter of 2022. The management expects further slowdown as it mentioned in the earnings presentation that it is anticipating a high-single-digit to low-double-digit loan growth in 2023. This target seems reasonable because the deposit book is under pressure due to the Fed’s monetary tightening. Bridgewater Bancshares’ deposit book dipped by 0.2% during the last quarter, though not all of the reduction was attributable to the monetary tightening. The management mentioned in the conference call that the deposits also declined because of seasonal outflows. The management also mentioned that it was selective about lending during the first quarter so as to better align loan growth with the funding outlook. Due to this strategy, I’m expecting the pressure on the deposit side to continue to affect loan growth in the upcoming quarters.
On the plus side, regional economic factors bode well for loan growth. Bridgewater Bancshares operates in the twin cities (Minneapolis and Saint Paul) area of Minnesota. This region has historically enjoyed a very low unemployment rate compared to the national average, as shown below.
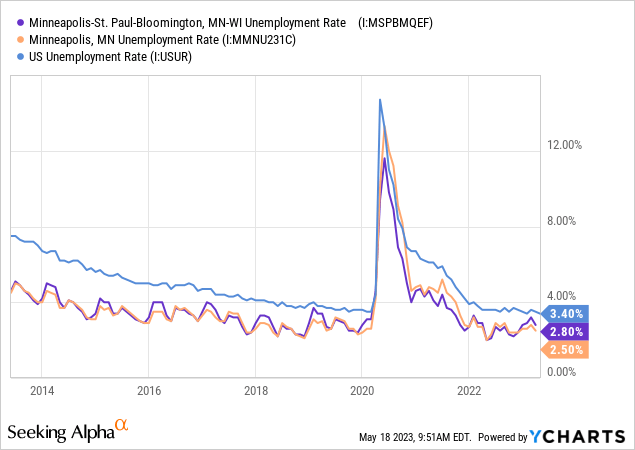
Due to the strong local job markets, I’m positive about growth in Bridgewater Bancshares’ main focus area of multifamily real-estate loans.
Considering these factors, I’m expecting the loan portfolio to grow by 9.5% and the deposit book to increase by 4.4% in 2023. The following table shows my balance sheet estimates.
| Financial Position | FY18 | FY19 | FY20 | FY21 | FY22 | FY23E |
| Net Loans | 1,640 | 1,884 | 2,282 | 2,770 | 3,512 | 3,847 |
| Growth of Net Loans | 23.7% | 14.9% | 21.1% | 21.4% | 26.8% | 9.5% |
| Other Earning Assets | 257 | 293 | 393 | 441 | 550 | 569 |
| Deposits | 1,561 | 1,823 | 2,502 | 2,946 | 3,417 | 3,567 |
| Borrowings and Sub-Debt | 182 | 174 | 142 | 135 | 477 | 771 |
| Common equity | 221 | 245 | 265 | 313 | 328 | 363 |
| Book Value Per Share ($) | 7.5 | 8.2 | 9.1 | 10.8 | 11.4 | 12.7 |
| Tangible BVPS ($) | 7.4 | 8.0 | 9.0 | 10.7 | 11.3 | 12.6 |
| Source: SEC Filings, Earnings Releases, Author’s Estimates (In USD million unless otherwise specified) | ||||||
Further Pressure on the Net Interest Margin Ahead
Bridgewater Bancshares’ net interest margin plunged by 44 basis points in the first quarter of 2023, which was worse than my expectations. Further, the deposit mix continued to deteriorate in the first quarter as deposits migrated from non-interest-bearing accounts into interest-bearing accounts. The proportion of non-interest-bearing deposits in total deposits dropped to 21.8% by the end of March 2023 from 25.9% at the end of December 2022.
The other side of the balance sheet is also not favorably positioned for a rising rate environment. A majority of the loans will not reprice this year, as can be seen in the loan mix chart below.
1Q 2023 10-Q Filing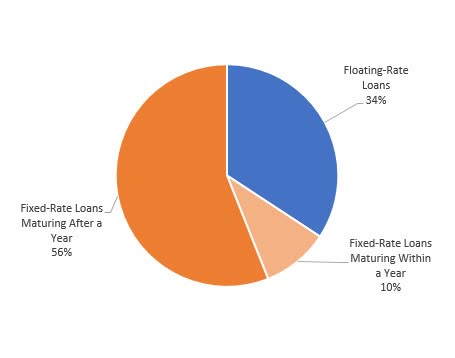
Moreover, Bridgewater Bancshares has a sizable securities portfolio with an average duration of 5.3 years. Therefore, only a small portion of this portfolio can be expected to reprice this year. Securities made up 13% of total earning assets at the end of March 2023.
The results of the management’s rate sensitivity analysis given in the 10-Q filing show that a 200-basis points hike in rates could decrease the net interest income by 9.29% over twelve months.
1Q 2023 10-Q Filing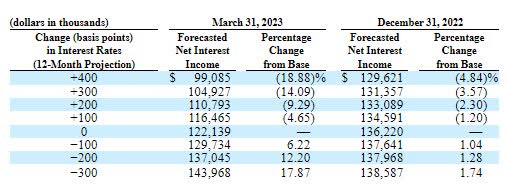
I’m expecting a further 25 basis point hike in the fed funds rate in June. For the second half of this year, I’m expecting interest rates to remain unchanged. Considering these factors, I’m expecting the margin to decline by a cumulative ten basis points in the second and third quarters before stabilizing in the fourth quarter of 2023. Compared to my last report on the company, I’ve reduced my net interest margin estimate partly because of the first quarter’s disappointing performance. Further, the deposit mix has already worsened more than I anticipated, which has forced me to reduce my estimate.
Expecting Earnings to Plunge by 22%
The pressure on the margin will play a key role in an earnings decline this year. On the other hand, loan growth will support earnings. Further, expense control efforts will help the earnings. Expenses fell during the first quarter as the management tightened control on its discretionary spending, according to details given in the conference call.
Overall, I’m expecting Bridgewater Bancshares to report earnings of $1.35 per share for 2023, down 22% year-over-year. The following table shows my income statement estimates.
| Income Statement | FY18 | FY19 | FY20 | FY21 | FY22 | FY23E |
| Net interest income | 65 | 74 | 88 | 110 | 130 | 114 |
| Provision for loan losses | 4 | 3 | 13 | 5 | 8 | 9 |
| Non-interest income | 3 | 4 | 6 | 5 | 6 | 8 |
| Non-interest expense | 32 | 37 | 45 | 48 | 57 | 56 |
| Net income – Common Sh. | 27 | 31 | 27 | 45 | 49 | 38 |
| EPS – Diluted ($) | 0.91 | 1.05 | 0.93 | 1.54 | 1.72 | 1.35 |
| Source: SEC Filings, Earnings Releases, Author’s Estimates (In USD million unless otherwise specified) | ||||||
Compared to my last report on the company, I’ve reduced my earnings estimate mostly because I’ve slashed my net interest margin estimate.
Risks are not a Cause for Concern
The management took concrete steps to reduce its uninsured deposits during the first quarter of 2023, which makes me confident about the company’s ability to survive any deposit run on the bank. As a result of these measures, uninsured deposits dropped to 24% of total deposits by the end of March 2023 from 38% of total deposits at the end of December 2022, as mentioned in the presentation. These uninsured deposits amount to $818 million and are comfortably covered by the company’s available liquidity of $1.9 billion.
The other major source of risk, i.e. unrealized mark-to-market losses on Available-for-Sale (“AFS”) securities, is also not worrisome. Unrealized losses on AFS securities were 10.6% of stockholders’ equity as of the end of March 2023, which isn’t too high. The market capitalization has already dropped by 37% since the start of the banking sector crisis on March 8, 2023. Therefore, the market has incorporated more than the risk from these unrealized losses.
Downgrading to a Hold Rating
Previously I was using the historical average price-to-tangible book (“P/TB”) and price-to-earnings (“P/E”) multiples to value Bridgewater Bancshares, which gave the company a very high fair value. I’ve now decided to value BWB using peer-average multiples because of the current banking crisis. This is because, in my opinion, banks will continue to trade below their historical averages until the situation in the banking sector normalizes and the systemic riskiness declines.
Peers are trading at an average P/TB ratio of 0.80 and an average P/E ratio of 6.3, as shown below.
| BWB | CIVB | BLFY | FISI | FLIC | SMMF | Peer Average | |
| P/E (“fwd”) | 6.83 | 5.27 | NM | 5.48 | 9.25 | 5.24 | 6.31 |
| P/B (“ttm”) | 0.75 | 0.72 | 0.60 | 0.64 | 0.66 | 0.69 | 0.66 |
| P/TB (“ttm”) | 0.75 | 1.17 | 0.59 | 0.76 | 0.65 | 0.84 | 0.80 |
| Source: Seeking Alpha | |||||||
Multiplying the average P/TB multiple with the forecast tangible book value per share of $12.6 gives a target price of $10.1 for the end of 2023. This price target implies a 13.2% upside from the May 19 closing price. The following table shows the sensitivity of the target price to the P/TB ratio.
| P/TB Multiple | 0.60x | 0.70x | 0.80x | 0.90x | 1.00x |
| TBVPS – Dec 2023 ($) | 12.6 | 12.6 | 12.6 | 12.6 | 12.6 |
| Target Price ($) | 7.6 | 8.9 | 10.1 | 11.4 | 12.7 |
| Market Price ($) | 9.0 | 9.0 | 9.0 | 9.0 | 9.0 |
| Upside/(Downside) | (15.0)% | (0.9)% | 13.2% | 27.3% | 41.4% |
| Source: Author’s Estimates |
Multiplying the average P/E multiple with the forecast earnings per share of $1.35 gives a target price of $8.5 for the end of 2023. This price target implies a 5.2% downside from the May 19 closing price. The following table shows the sensitivity of the target price to the P/E ratio.
| P/E Multiple | 4.3x | 5.3x | 6.3x | 7.3x | 8.3x |
| EPS 2023 ($) | 1.35 | 1.35 | 1.35 | 1.35 | 1.35 |
| Target Price ($) | 5.8 | 7.1 | 8.5 | 9.8 | 11.2 |
| Market Price ($) | 9.0 | 9.0 | 9.0 | 9.0 | 9.0 |
| Upside/(Downside) | (35.3)% | (20.2)% | (5.2)% | 9.8% | 24.8% |
| Source: Author’s Estimates |
Equally weighting the target prices from the two valuation methods gives a combined target price of $9.3, which implies a 4.0% upside from the current market price. My updated target price is much below my previous target price which was based on historical multiples. Therefore, I’m downgrading Bridgewater Bancshares to a Hold rating from my previous rating of Buy.
Credit: Source link


