Oli Scarff/Getty Images News
Introduction
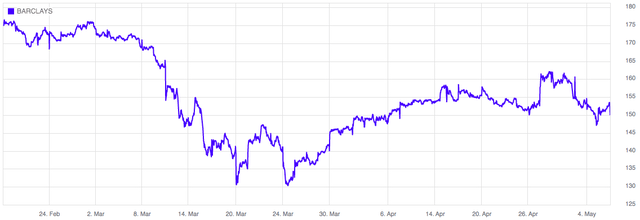
Barclays PLC (NYSE:BCS) shareholders have had a bumpy ride since my previous Seeking Alpha BCS note, published in February 2023. My February Strong Buy call was based on a cum-dividend price of 175.88p (London Stock Exchange close, 20 February 2023). Adjusting for the 5p per share dividend, when BCS traded down to ~130p in March 2023, my February call was underwater by around 24%. Short-term volatility is an almost constant feature of equity markets, and I remind readers that my research and stock calls are medium-term focussed. The collapses of SVB Financial and Credit Suisse triggered a wave of weakness in bank share prices and recent news flow regarding the US regional banking sector suggests that investors may again have further opportunities to purchase bank stocks on fear-driven dips.
BCS is currently (London Stock Exchange 05 May 2023 closing price 153.24p) trading ~18% above its March 2023 lows, but remains ~10% below my February Strong Buy call price point. In this note I will review the company’s 1Q23 result materials and provide an updated stock rating.
Source: London Stock Exchange
1Q23 RoTE 15% – Pleasing But Not Sustainable
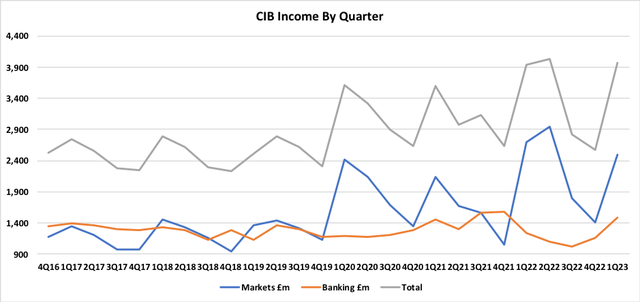
BCS delivered a strong RoTE (return on tangible equity) of 15% in 1Q23. For investors more interested in ROE, allowing for the carrying value of goodwill and intangibles reduces the 1Q23 return to a still respectable ~12.7%. Whilst the 15% RoTE outcome is pleasing, it is important to recognise that this is not a sustainable level of RoTE for BCS. Seasonal influences tend to provide a boost to 1Q earnings. Exhibit 1 highlights that Markets income (reported within the Corporate & Investment Bank division, CIB) is typically well above average in 1Q and this was again the case for 1Q23. On the expense side, there is no UK bank levy charge during 1Q. I also note that litigation and conduct contributed +£1m to pre-tax profit in 1Q23, whereas a more typical quarterly contribution would be a charge of around -£50m.
Exhibit 1:
Source: Prepared by author based on Barclays financial reports.
Given the number of materially uncertain variables in play, it’s impossible to say exactly what level of RoTE is sustainable for BCS (and almost any bank for that matter). BCS management have set a FY23E target for RoTE of at least 10%; this looks likely to be comfortably met given the solid start to the year. My personal view is that the sustainable RoTE for BCS is likely to be slightly below the FY23E target of >10%, and certainly much lower than the 1Q23 outcome of 15%. Looking at the most recent analyst consensus numbers published by BCS, it appears that the sell-side has settled on an RoTE of around 10% (consensus RoTE: FY23E 10.1%, FY24E 9.9%, FY25E 10.1%).
Readers might conclude that I’m trying to set a bearish tone regarding the BCS RoTE story by highlighting that 1Q23’s 15% RoTE is not sustainable. However, given that Barclays shares are trading at just 51% of 1Q23 NTA (301p per share), a bullish investment case can be constructed without needing to take an over-optimistic position on the company’s future profitability. If the sell-side is correct and the market arrives at the view that BCS can generate a sustainable RoTE of ~10%, I would expect the stock to re-rate to around 85% to 100% of NTA – implying upside from current price levels of 67% to 96% – that sounds pretty bullish to me.
Higher Bad Debt Charges – As Expected
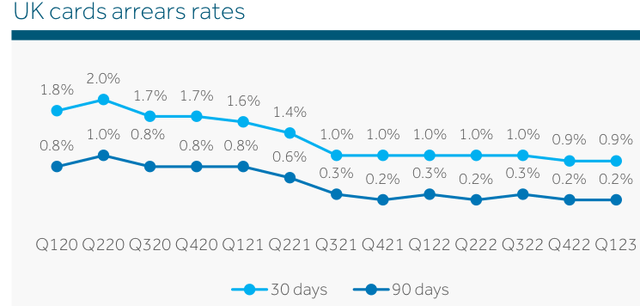
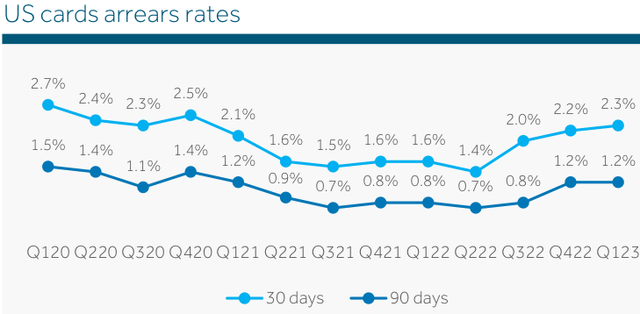
Whenever the economic outlook is looking rather fragile, it is always worth keeping a close eye upon arrears levels for credit cards and other unsecured consumer loans. Exhibits 2 and 3 show arears rates for the group’s UK and US credit card books. I have been rather bearish about the UK economic outlook for some time, and so it is somewhat comforting to see that the BCS UK credit card book is not yet showing any signs of stress. Arrears in the US credit card book remain low, but the rapid increase in 30-day arrears over recent months is slightly concerning. BCS has a long history in the UK credit card market and I feel confident in the group’s ability to tightly manage UK credit card risk. I will be monitoring the US credit card book closely in coming quarters.
Exhibit 2:
Source: Barclays 1Q23 Presentation, slide 28.
Exhibit 3:
Source: Barclays 1Q23 Presentation, slide 28.
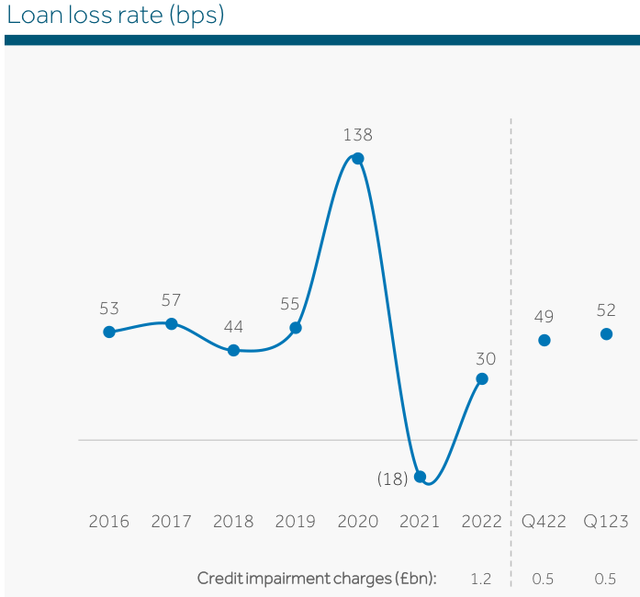
BCS CFO Anna Cross referenced an FY23E bad debt loss rate of 50bp to 60bp when delivering the FY22 result. Following a bad debt loss rate of 52bp in 1Q23, the FY23E guidance of 50bp to 60bp remains in place. From a credit risk perspective there is nothing to worry about here – we are simply seeing a normalisation back toward historical average bad debt loss rates. That said, it is important not to be complacent regarding credit risk; banks have a nasty habit of reacting to credit quality deterioration slightly too late. My BCS valuation model allows for a conservatively set bad debt loss rate, providing a deliberate buffer against unexpected bad debt losses.
Exhibit 4:
Source: Barclays 1Q23 Presentation, slide 14.
Barclays UK – Net Interest Margin
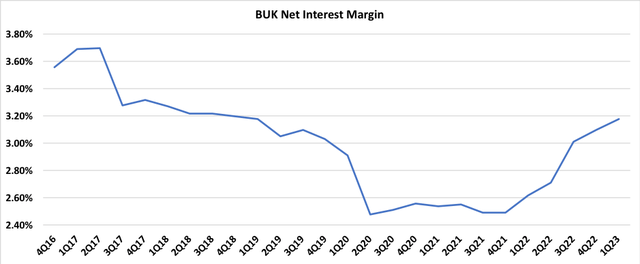
Exhibit 5 plots the net interest margin, ‘NIM’, for BUK (Barclays UK division). BUK’s NIM has recovered to pre-pandemic levels. External and internal conditions have changed materially for BUK between late 2019 and 1Q23 and therefore we cannot simply conclude that BUK’s NIM is now back to ‘normal’. Let’s take a simplistic look at a few of the moving parts of the NIM story.
Bank of England base rates have moved from 0.75% in late 2019 to sit at 4.25% at the time of writing (with a further +0.25% move expected in the near future); all else being equal this factor ought to push NIM upwards. BUK’s loan book at 1Q23 has a lower exposure to credit cards relative to late 2019 levels; business mix change within BUK is likely to have pushed NIM downwards relative to late 2019. BCS is now carrying a much higher level of liquidity (1Q23 £333bn) relative to late 2019 (4Q19 £211m); all else being equal, the high liquidity balance ought to push NIM downwards. There have obviously been other factors impacting BUK’s NIM movement between late 2019 and 1Q23 – there are many moving parts to consider. Similarly, the future progression for BUK’s NIM will be affected by a range of internal and external factors, many of which are difficult or impossible to forecast with confidence.
Exhibit 5:
Source: Author’s calculations based on Barclays financial reports.
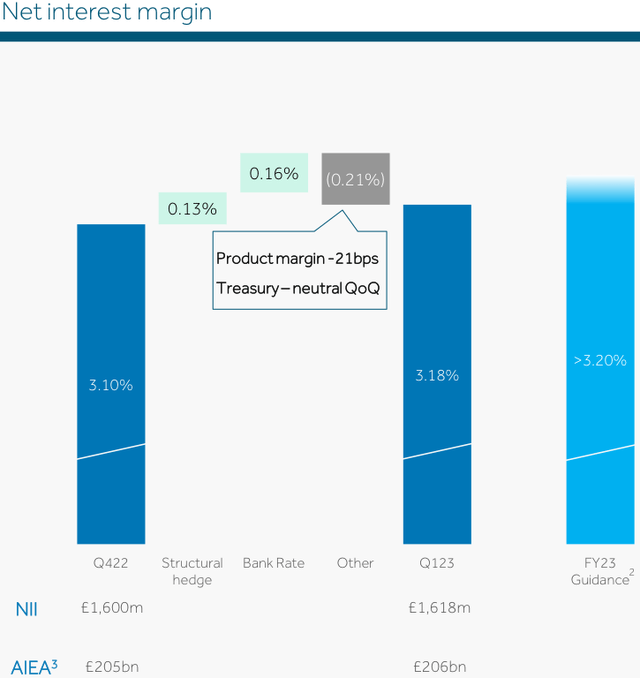
Much has been written about the beneficial impact of higher interest rates on BUK’s NIM, in part driven by illustrative data provided by BCS. I do not disagree with the conclusion that BUK’s earnings have benefitted materially from higher interest rates and that BUK will continue to enjoy future NIM tailwinds in coming quarters, however it is important to maintain a balanced view about the potential upside. Exhibit 6 shows that natural market competitive tension is already offsetting much of the positive impact of higher interest rates on BUK’s NIM.
An interesting issue to consider: what will happen to BUK’s NIM when the upward momentum from higher interest rates fades? Will the competitive tension that is now well and truly alive simply halt, or will BUK’s NIM suffer a decline? I think that there is a good chance that BUK’s NIM will peak in late FY23 and then fall back slightly in FY24. I also follow the Australian banking sector – competitive pressures Down Under are leading analysts and investors in that market to conclude that ‘peak margin’ has already passed. From my perspective, it is only a matter of time before BUK passes through its own peak margin.
Exhibit 6:
Source: Barclays 1Q23 Presentation, slide 15.
Anaemic UK Loan Book Growth
With all the focus on BUK’s NIM, an important issue is often missed – it is the combination of NIM and movements in average interest earning assets over time that drives net interest income growth. Loan growth in BUK is currently almost non-existent. The total BUK loan book stood at £208.2bn as at 31 March 2023. A year earlier, the loan book was £207.3bn, implying annual growth of just 0.4%. On 01 March 2023 BUK completed the acquisition of UK specialist mortgage lender KMC – adding a portfolio of mortgages totalling £2.2bn. Excluding the KMC portfolio, BUK’s loan book actually shrunk by -0.6% over the last twelve months. Whilst NIM is certainly a key factor for investors to consider, by itself it is insufficient to support a robust investment case. In the absence of an improvement in loan book growth, when BUK’s NIM starts to flatten or decline, we may actually see BUK net interest income heading backwards for a period.
Summary & Conclusion
Barclays reported a solid set of numbers at 1Q23 and I found nothing in the results materials that warranted a significant change to my stock valuation and investment case. Consistent with my analysis, management’s outlook for FY23E remains unchanged from that issued at 4Q22. Barclays is currently trading at slightly above 50% of the company’s reported 31 March 2023 TNAV of 301p per share; this hefty discount to TNAV appears unwarranted given that the company has genuine potential to sustainably generate a RoTE close to, and possibly above, its cost of capital.
In order to embed a degree of conservatism in my analysis, my investment case for BCS assumes a sustainable RoTE of 9%, which is ~1% lower than consensus forecasts published by the company. On this basis, I see upside of 40% to 60% from current price levels (London Stock Exchange 05 May 2023 closing price 153.24p). I anticipate FY23E dividends to exceed FY22’s total dividend of 7.5p per share, implying that BCS is currently trading on a dividend yield of in excess of 5% pa. I remain very comfortable with a Strong Buy rating on BCS.
Credit: Source link


