


kynny
A Quick Take On Agiliti
Agiliti (NYSE:AGTI) reported its Q1 2023 financial results on May 9, 2023, beating revenue and earnings consensus estimates.
The firm sells medical and healthcare equipment products and maintenance services in the United States.
AGTI’s revenue growth has dropped and profits have been declining.
While the stock may be a defensive play for deteriorating macroeconomic conditions, I’m Neutral (Hold) on the stock for the near term.
Agiliti Overview
Minneapolis, Minnesota-based Agiliti was founded in 1939 to provide a wide range of medical and healthcare equipment products and related services to the U.S. healthcare system.
Management is headed by President and Chief Executive Officer, Thomas Boehning, who has been with the firm since 2020 and was previously CEO at Optum360.
The company’s primary offerings include:
-
Onsite managed services
-
Clinical engineering services
-
Equipment solutions
The firm counts as customers thousands of hospitals, delivery networks and alternate site medical care providers, both privately-held and government-owned.
Agiliti’s Market & Competition
According to a 2020 market research report by IBISWorld, the U.S. medical equipment repair and maintenance market, which is a subset of the firm’s service offerings, was $10.2 billion in 2022, representing an annual growth over the prior year of 1.8%.
The market will have grown at an estimated 0.8% average annual growth rate from 2017 to 2022.
The main drivers for this expected growth are increasing demand for medical services as the U.S. population ages due to the Baby Boomer generation retiring at an average rate of 10,000 per day.
Additionally, the growth in chronic diseases and demand for improved medical devices will continue to drive the market.
The imaging equipment market accounted for the largest share of the market in 2020, representing 35.8% of the total market.
Also, another market research firm, Prescient & Strategic Intelligence, puts the repair and maintenance market size much higher, at $8.3 billion in 2019 and growing at a CAGR of 9.2% from 2020 to 2030.
Grand View Research estimates the global hospital outsourcing market size at $271 billion in 2019 and expects it to grow at a CAGR of 10.4% from 2020 to 2027.
Below is a chart showing the historical and expected future growth of the U.S. hospital outsourcing services market:
U.S. Hospital Outsourcing Market (Grand View Research)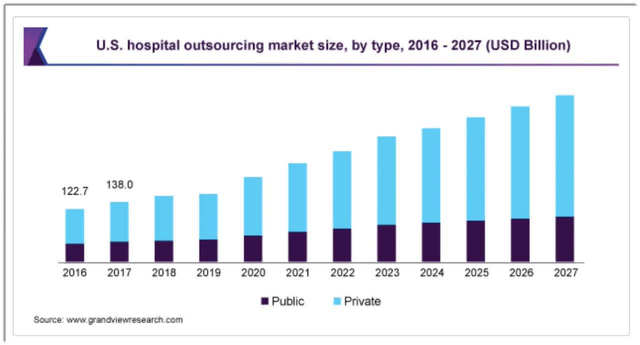
Major competitive or other industry participants include:
-
Allscripts
-
Cerner
-
The Allure Group
-
Integrated Medical Transport
-
Sodexo
-
Aramark
-
LogistiCare Solutions
-
Flatworld Solutions
-
Alere
-
ABM Industries
Agiliti’s Recent Financial Trends
-
Total revenue by quarter has plateaued in recent quarters:
Total Revenue (Seeking Alpha)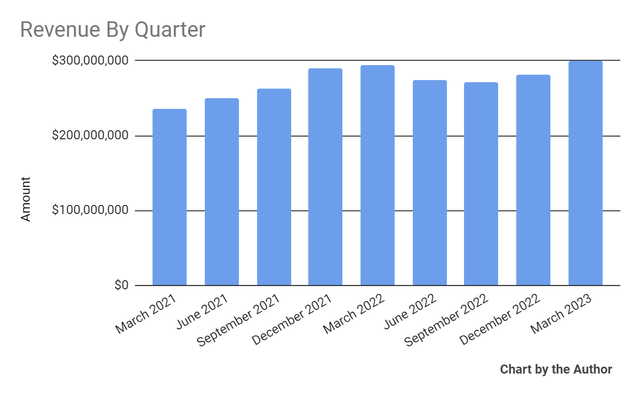
-
Gross profit margin by quarter has trended lower more recently:
Gross Profit Margin (Seeking Alpha)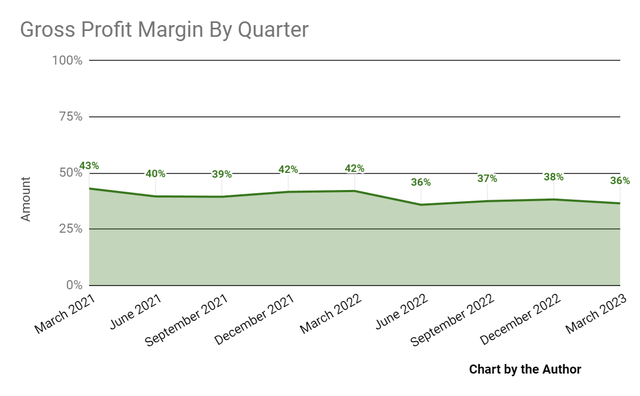
-
Selling, G&A expenses as a percentage of total revenue by quarter have trended higher in recent quarters, a negative signal indicating that the firm is spending more on adding incremental revenue.
Selling, G&A % Of Revenue (Seeking Alpha)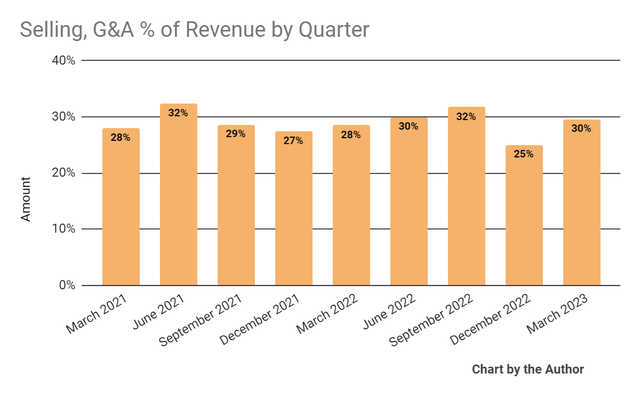
-
Operating income by quarter has been trending lower in recent quarters:
Operating Income (Seeking Alpha)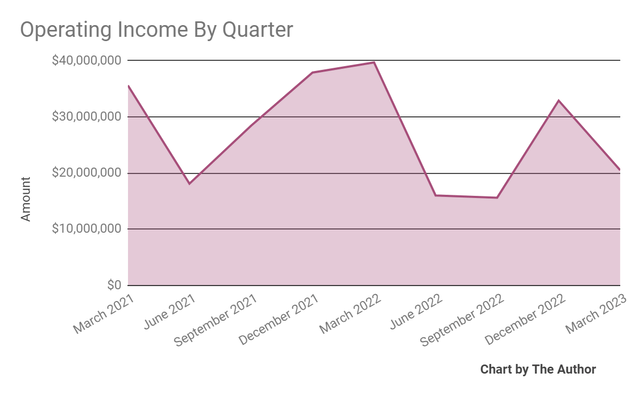
-
Operating leverage by quarter has turned negative in Q1 2023:
Operating Leverage (Seeking Alpha)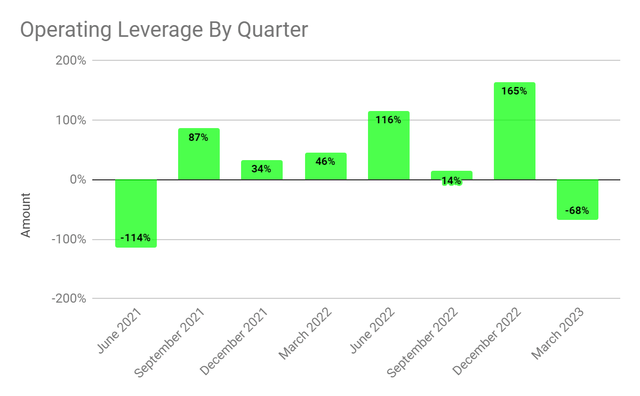
-
Earnings per share (Diluted) have been trending lower in recent quarters:
Earnings Per Share (Seeking Alpha)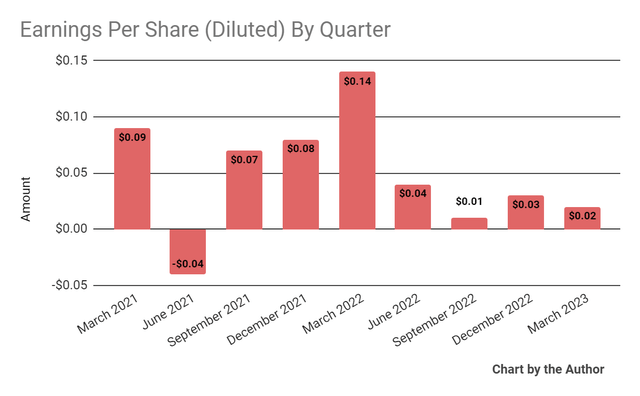
(All data in the above charts is GAAP)
In the past 12 months, AGTI’s stock price has dropped 9.94% vs. that of the S&P 500 Index’s (SPY) rise of 6.98%, as the chart indicates below:
52-Week Stock Price Comparison (Seeking Alpha)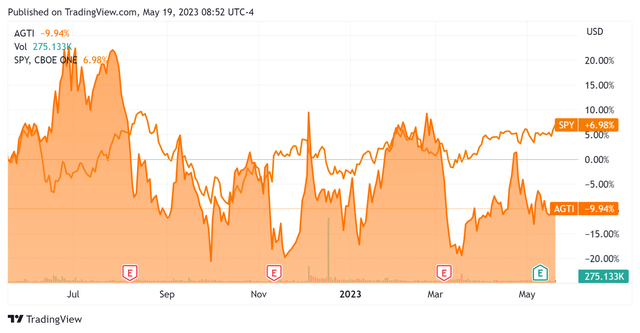
For the balance sheet, the firm ended the quarter with $18.4 million in cash, equivalents and trading asset securities and $1.08 billion in total debt, of which $9.4 million was categorized as the current portion due within 12 months.
Over the trailing twelve months, free cash flow was $96.4 million, of which capital expenditures accounted for $91.1 million. The company paid $21.0 million in stock-based compensation in the last four quarters, the highest figure in the past eleven-quarter period.
Valuation And Other Metrics For Agiliti
Below is a table of relevant capitalization and valuation figures for the company:
|
Enterprise Value/Sales |
3.0 |
|
Enterprise Value/EBITDA |
12.7 |
|
Price/Sales |
1.9 |
|
Revenue Growth Rate |
2.6% |
|
Net Income Margin |
1.2% |
|
EBITDA % |
23.3% |
|
Market Capitalization |
$2,160,000,000 |
|
Enterprise Value |
$3,330,000,000 |
|
Operating Cash Flow |
$187,550,000 |
|
Earnings Per Share (Fully Diluted) |
$0.10 |
(Source – Seeking Alpha)
Commentary On Agiliti
In its last earnings call (Source – Seeking Alpha), covering Q1 2023’s results, management highlighted its ‘balanced outlook’ for the rest of 2023 and noted the increase in its group purchasing organization activity, which brings larger customers to the company.
However, these larger-scale purchasing contracts can result in lower margins, and we’ve seen the firm’s gross margin drop in recent quarters, possibly as a result of this.
Also, implementation costs are typically front-loaded, raising costs in the near term and reducing profitability in early periods.
Total revenue for Q1 2023 rose only 1.9% year-over-year, while gross profit margin fell by 5.5 percentage points.
Selling, G&A expenses as a percentage of revenue grew by 1.1 percentage points, a negative signal indicating that the company is spending more on sales. Operating income fell sharply by 48.4% year-over-year.
Looking ahead, management reaffirmed its guidance for full-year 2023, expecting topline revenue growth of 5% at the midpoint of the range.
Adjusted earnings per share are expected to be $0.675 at the midpoint of the range. Notably, management expects higher interest expenses on its substantial debt load.
The company’s financial position isn’t great, with little cash on hand, over $1 billion in long-term debt but reasonably strong positive free cash flow.
From management’s most recent earnings call, I prepared a chart showing the frequency of key terms mentioned (or not) in the call, as shown below:
Earnings Transcript Key Term Frequency (Seeking Alpha)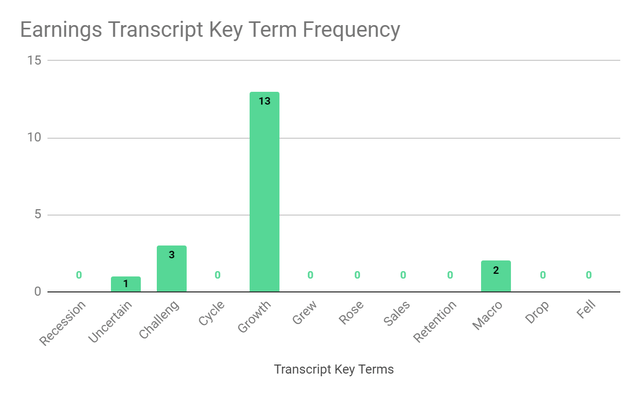
I’m most interested in the frequency of potentially negative terms, so management cited ‘Uncertain’ once, ‘Challeng(es)(ing)’ three times, and ‘Macro’ two times.
The negative terms refer to the ongoing difficulty the U.S. healthcare vendor system faces with capital constraints, labor shortages, supply chain disruptions and inflation.
In the past twelve months, the firm’s EV/EBITDA valuation multiple has risen 13.3%, as the chart from Seeking Alpha shows below:
EV/EBITDA Multiple History (Seeking Alpha)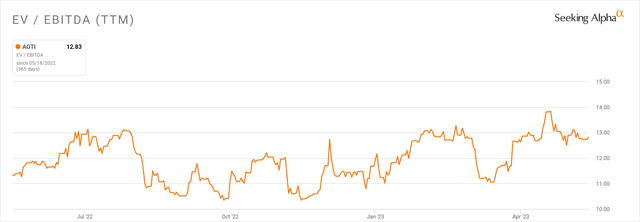
A potential upside catalyst to the stock could include relative strength in demand as macroeconomic conditions decline as 2023 progresses, with investors focusing on defensive industries such as healthcare.
However, profits have declined over the past twelve months while revenue growth has remained very low.
As a result, I don’t see a material organic upside catalyst to the stock in the near term, so my outlook on AGTI is Neutral (Hold).
Credit: Source link


