

• bitcoinBitcoin(BTC)$79,578.00-1.51%
  • ethereumEthereum(ETH)$2,452.47-2.00%
  • tetherTether(USDT)$1.000.02%
  • binancecoinBNB(BNB)$721.08-0.11%
  • rippleXRP(XRP)$1.40-3.16%
  • usd-coinUSDC(USDC)$1.000.00%
  • solanaSolana(SOL)$101.86-1.67%
  • tronTRON(TRX)$0.3320680.74%
  • Figure HelocFigure Heloc(FIGR_HELOC)$1.040.54%
  • HyperliquidHyperliquid(HYPE)$84.14-3.69%
  • zcashZcash(ZEC)$1,015.368.06%
  • dogecoinDogecoin(DOGE)$0.084668-2.64%
  • RainRain(RAIN)$0.016452-3.87%
  • moneroMonero(XMR)$528.083.40%
  • USDSUSDS(USDS)$1.00-0.01%
  • chainlinkChainlink(LINK)$11.66-1.53%
  • whitebitWhiteBIT Coin(WBT)$73.12-0.88%
  • leo-tokenLEO Token(LEO)$9.22-1.21%
  • cardanoCardano(ADA)$0.210078-5.61%
  • stellarStellar(XLM)$0.178752-2.13%
  • bitcoin-cashBitcoin Cash(BCH)$245.88-3.58%
  • daiDai(DAI)$1.00-0.01%
  • Ethena USDeEthena USDe(USDE)$1.000.01%
  • CantonCanton(CC)$0.107388-3.95%
  • USD1USD1(USD1)$1.000.00%
  • litecoinLitecoin(LTC)$51.520.99%
  • the-open-networkGram (prev. Toncoin)(GRAM)$1.402.61%
  • uniswapUniswap(UNI)$6.18-2.27%
  • hedera-hashgraphHedera(HBAR)$0.0788080.28%
  • Global DollarGlobal Dollar(USDG)$1.000.00%
  • avalanche-2Avalanche(AVAX)$7.39-1.45%
  • suiSui(SUI)$0.76-1.03%
  • shiba-inuShiba Inu(SHIB)$0.000005-2.14%
  • paypal-usdPayPal USD(PYUSD)$1.00-0.01%
  • nearNEAR Protocol(NEAR)$2.1912.72%
  • BlackRock USD Institutional Digital Liquidity FundBlackRock USD Institutional Digital Liquidity Fund(BUIDL)$1.000.00%
  • tether-goldTether Gold(XAUT)$4,429.58-0.91%
  • crypto-com-chainCronos(CRO)$0.055803-2.72%
  • Circle USYCCircle USYC(USYC)$1.140.04%
  • MemeCoreMemeCore(M)$1.138.76%
  • Ripple USDRipple USD(RLUSD)$1.000.01%
  • okbOKB(OKB)$109.220.48%
  • Ondo US Dollar YieldOndo US Dollar Yield(USDY)$1.140.01%
  • BittensorBittensor(TAO)$226.14-0.26%
  • aaveAave(AAVE)$130.15-2.26%
  • AsterAster(ASTER)$0.732.45%
  • pax-goldPAX Gold(PAXG)$4,436.09-0.95%
  • mantleMantle(MNT)$0.570.74%
  • World Liberty FinancialWorld Liberty Financial(WLFI)$0.056487-1.88%
  • OndoOndo(ONDO)$0.3671821.00%
TradePoint.io
  • Main
  • AI & Technology
  • Stock Charts
  • Market & News
  • Business
  • Finance Tips
  • Trade Tube
  • Blog
  • Shop
No Result
View All Result
TradePoint.io
No Result
View All Result

Investor Outlook – The Puts To Calls Ratio (SP500)

July 9, 2023
in Market & News
Reading Time: 4 mins read
A A
Investor Outlook – The Puts To Calls Ratio (SP500)
ShareShareShareShareShare

PashaIgnatov

YOU MAY ALSO LIKE

With plans to renovate a D.C. golf course, Trump tees up another fight with residents

Spanish firefighters save calf from smoke and flames

The Investor Outlook series will focus on specific indicators that measure what investors are thinking and doing about the market. This article looks at the well known “puts to calls” ratio.

The “Puts to Calls” Ratio

Since “call” options are a bet the market will rise and “put” options a bet it will decline, the ratio of “put buying” to “call buying” provides insight into what investors expect. This ratio was developed by market technician Marty Zweig back in 1971, so it has a long history.

The CBOE (Chicago Board Option Exchange) publishes this ratio each day and the Sentiment King then averages the ratio over twenty days. This average helps filter out short-term statistical “noise” and provides longer term investor outlooks.

The ratio acts as a contrary opinion indicator and helps spot when too many investors are either bullish or bearish. History shows you can invest with the crowd for a while, but when the crowd gets too lopsided, it’s time to go the other way. The ratio helps find these moments.

The chart below plots this ratio against the S&P 500 for the last seventeen years.
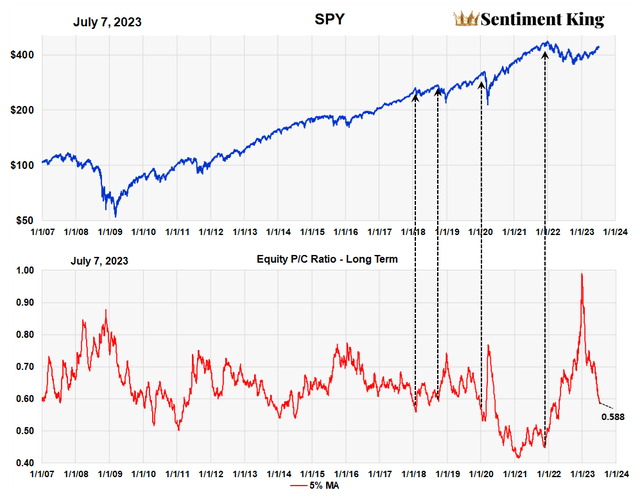
20 Day Average of the Daily Puts to C

20 Day Average of the Daily Puts to Calls Ratio (Sentiment King)

Historically, a ratio of .75 or more has been a good signal that a decline is over and the market is getting ready to advance. There are simply too many bears. In fact, the record high ratio last November was a major factor that helped us call the end of the bear market (The Equity ‘Puts To Calls’ Ratio Finally Signals A Bull Market) and the start of a new bull market.

Using the “puts to calls” ratio to find major market tops is less successful. It tends to reach lows early and give false signals. As a general rule, however, ratios of .55 or less usually occur prior to a major decline. We’ve indicated a few with four, dashed arrows.

Unfortunately, these ratios often come before the top of the market, so it’s not good at timing the top of markets. For example, the lowest ratio occurred in late January of 2021, a year before the start of the bear market.

However, the ratio has value at early stages of a bull market since the likelihood of a major advance occurring before the ratio gets to .55 or less is very low.

As indicated on the chart, the current ratio is .588. Where does this ratio stand historically?

The Sentiment King’s Ranking of the Current “Puts to Calls” Ratio

It is easier to see what the current ratio means when we put it on the Sentiment King ranking scale. The SK ranking scale gives the ratio historical perspective. Green Zone readings mean there are too many bears and red zone readings mean too many people are now bullish. These occur when the ratio is in the top or bottom 10% of historic values.
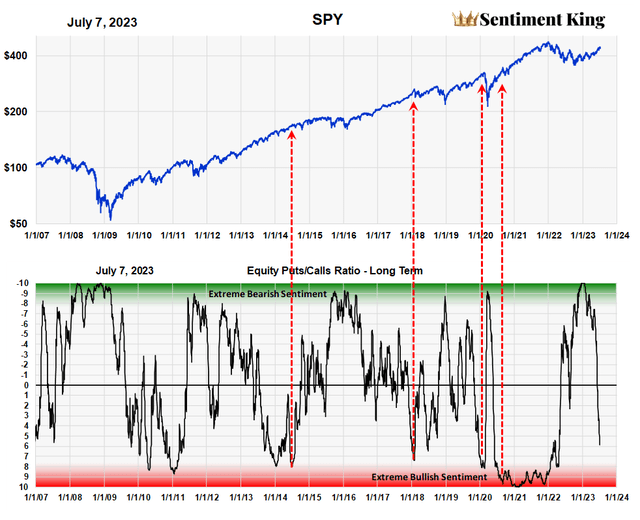
Ranking of the Puts to Calls Ratio on the SK Ranking Scale

Ranking of the Puts to Calls Ratio on the SK Ranking Scale (Sentiment King)

There’s a large band in between we call the neutral zone and most of the time the ratio lies in this zone. It’s important to note that the “puts to calls” ratio only has meaning when it’s at extremes – either in the red or green zones; neutral readings have no value.

We can use the ratio at early stages of a bull market since the likelihood of a major decline occurring before the ratio first reaches the red zone is highly unlikely. You can see from the chart that the current ratio of .588 is not in the red zone yet. At +6 the ratio is in the lowest 20% of historic readings. To get to reach the red zone it has to be in the lowest 10% of historic readings.

Conclusion

Since the strong buy signal late last year, the ratio has been declining as fewer investors buy “puts” and more buy “calls.” History shows investors don’t have to worry about the end of a bull market until the ratio first reaches a red zone reading somewhere during the move. Even then it’s not a signal of a market decline.

Credit: Source link

ShareTweetSendSharePin

Related Posts

With plans to renovate a D.C. golf course, Trump tees up another fight with residents
Market & News

With plans to renovate a D.C. golf course, Trump tees up another fight with residents

September 5, 2026
Spanish firefighters save calf from smoke and flames
Market & News

Spanish firefighters save calf from smoke and flames

September 5, 2026
Troy Jackson nominated to replace Graham Platner
Market & News

Troy Jackson nominated to replace Graham Platner

September 5, 2026
TODAY’s Sheinelle Jones talks about the ‘excruciating lows’ of losing her husband: Full interview
Market & News

TODAY’s Sheinelle Jones talks about the ‘excruciating lows’ of losing her husband: Full interview

September 5, 2026
Next Post
Why Munis, High Yield Are Better Choices Than Pricey Stocks

Why Munis, High Yield Are Better Choices Than Pricey Stocks

Leave a Reply Cancel reply

Your email address will not be published. Required fields are marked *

Search

No Result
View All Result
Dr. Anthony Fauci’s journal reveals how Trump and Biden handled Covid cases

Dr. Anthony Fauci’s journal reveals how Trump and Biden handled Covid cases

September 3, 2026
Drone video shows the extent of the Spain wildfires

Drone video shows the extent of the Spain wildfires

September 4, 2026
Sailor rescued after a month stranded at sea

Sailor rescued after a month stranded at sea

September 4, 2026

About

Learn more

Our Services

Legal

Privacy Policy

Terms of Use

Bloggers

Learn more

Article Links

Contact

Advertise

Ask us anything

©2020- TradePoint.io - All rights reserved!

Tradepoint.io, being just a publishing and technology platform, is not a registered broker-dealer or investment adviser. So we do not provide investment advice. Rather, brokerage services are provided to clients of Tradepoint.io by independent SEC-registered broker-dealers and members of FINRA/SIPC. Every form of investing carries some risk and past performance is not a guarantee of future results. “Tradepoint.io“, “Instant Investing” and “My Trading Tools” are registered trademarks of Apperbuild, LLC.

This website is operated by Apperbuild, LLC. We have no link to any brokerage firm and we do not provide investment advice. Every information and resource we provide is solely for the education of our readers. © 2020 Apperbuild, LLC. All rights reserved.

No Result
View All Result
  • Main
  • AI & Technology
  • Stock Charts
  • Market & News
  • Business
  • Finance Tips
  • Trade Tube
  • Blog
  • Shop

© 2023 - TradePoint.io - All Rights Reserved!