
Mongkol Onnuan
Approximately two months ago, I wrote an article on the PIMCO Dynamic Income Fund (NYSE:PDI) elaborating on the three most important risk factors to consider before longing the CEF.
The key takeaways were the following:
#1 Significant concentration in the non-agency MBS, which in the context of weakening economy and surging interest rates introduces a lot of risk
The non-agency MBS are comprised of borrowers, who carry weaker credit profiles, which are not sufficient to qualify for cheaper agency backed credit. As a result there are no credit guarantees attached to these MBS that could shield investors from credit default events.
These risks have become more elevated due to clear signs of rising delinquencies and increasing mortgage payment-to-income ratios.
Moreover, by looking at how the market has been pricing residential equity REITs (i.e., ~30% drop in price since early 2022), we can make a safe conclusion that the loss given default component is increasingly becoming more challenging.
In essence, we can see correlation risk starting to become more evident as both components of credit risk have deteriorated – i.e., probability of defaults have increased and the values of collateral have decreased.
#2 Search for high yield in extremely high risk departments
Currently, ca. 22% of the PDI’s exposure is structured against high-yield credit, where the lion’s share of these allocations is placed in the banking / finance and utility segments.
As we know, the banking and finance companies are facing serious challenges amid recessionary risk and struggling pockets of the economy due to surging interest rates.
As of now, PDI is has the following exposures in high yield space (several examples):
- 7 of 103 instruments relate to SVB Financial Group (OTCPK:SIVBQ) (OTCPK:SIVPQ).
- 34 of 103 instruments relate to Credit Suisse (CS)
- 6 of 103 instruments relate to Banca Monte dei Paschi di Siena (OTCPK:BMDPF) – the world’s oldest bank that has been bailed out by the Italian Government, currently faces significant profitability and trust challenges (e.g., ~50% of its pre-tax profits coming from tax havens)
This is not safe neither from the systematic nor from the idiosyncratic risk perspective. Against the backdrop of declining energy prices, the financial prospects of these companies are set to experience incremental headwinds, where the non-IG names should suffer the most.
#3 Leverage on leverage is typically not the best strategy amid rising interest rates and mounting risks of economic slowdown
Currently, PDI employs 40% of external leverage to magnify the returns.
Here the notion of applying leverage on leverage on top of the already extremely volatile and risky underlying instruments increases the overall risk of the CEF. In the case of potential defaults (which per definition for high yield instruments are of a higher probability), the losses will hurt in an amplified fashion.
Synthesis of RCS
The PIMCO Strategic Income Fund (NYSE:RCS) is the second highest yielding CEF, right before PDI, that is managed by the PIMCO.
The objective of RCS is to generate a level of income higher than that generated by high-quality, intermediate-term U.S. debt securities. RCS’s investable universe is very flexible as the managers are allowed to select what they believe to be the most attractive instruments across the full spectrum of fixed income sectors.
Similar to PDI, RCS applies external leverage to enhance the yield potential. Currently, RCS has sourced 34.5% of total assets via reverse repo agreements.
PIMCO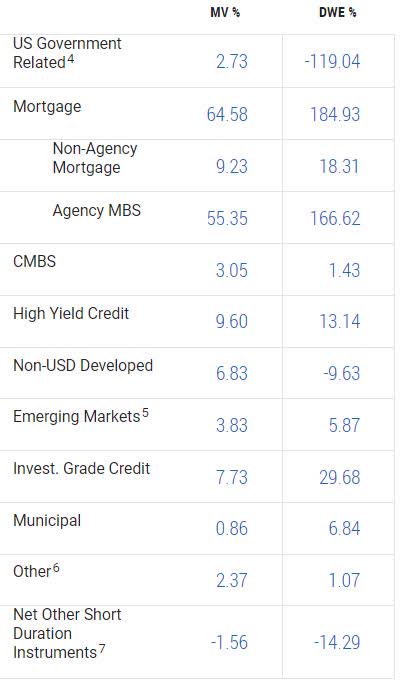
The bulk of RCS’s assets are allocated into mortgage instruments from which majority is agency backed. The remaining portion is somewhat equally distributed among non-US developed, high yield credit and investment grade credit securities. Currently, 85% of the assets are located in the U.S. geography.
The case for RCS and not for PDI
Currently, RCS and PDI offer yields of 11.7% and 14.1%, respectively. So, from the yield perspective, PDI is more attractive.
YCharts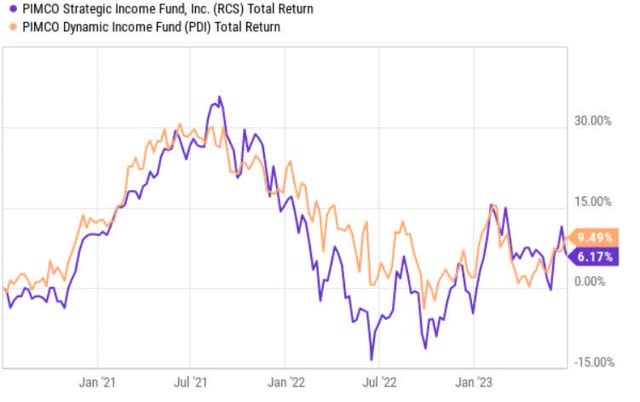
In the past three year period, the performance of both CEFs has been rather similar with PDI slightly outperforming RCS.
YCharts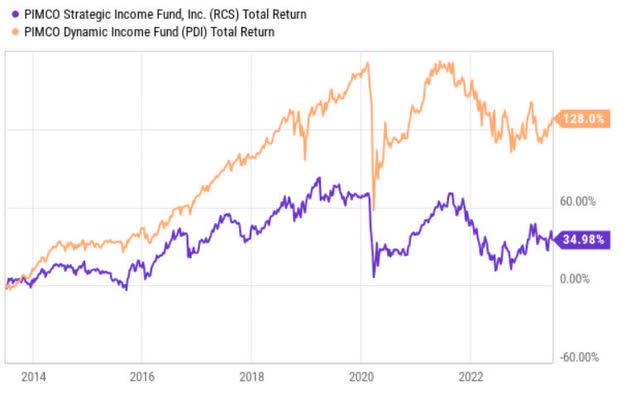
Nevertheless, if we zoom back even more, then it becomes clear how PDI has massively outperformed RCS. The key reason for this is that PDI inherently carries higher risk exposures, which are greatly compensated for under rallying markets and decreasing interest rates.
At the same time, when the COVID-19 broke out and risks became more elevated, PDI got punished in a more painful manner than RCS.
The key differences between the RCS and PDI are the following:
- RCS has lower duration profile with effective maturities at 5.2 years vs 7.2 years of PDI.
- RCS is a much safer instrument as ca. half of its portfolio is placed in agency backed securities, whereas for PDI about the same level of allocation is made in MBS, but into more risky, non-agency backed securities.
- RCS holds twice as low exposure to high yield credit as PDI (i.e., 9.6% vs 22.4%, respectively, from the total portfolio value).
- RCS carries slightly lower amount of external leverage than PDI.
- Lastly, PDI has by 20% (from the total portfolio perspective) higher exposure towards non-US investments, implying more elevated FX and regulatory risks.
In other words, the difference in yields of roughly 240 basis points is attributable to PDI’s higher duration and significantly more pronounced credit risk profile.
Against the backdrop of prevailing macroeconomic dynamics and the risks possessed by the two CEFs (as outlined above), RCS seems to be a better choice.
The baseline for the future interest rates is that there will be two additional hikes. The current view of the financial market participants is that by year-end 2023 the FED Funds rate should land in the 5.5% – 5.75% range, which implies an additional 0.5% hike.
Higher interest rates and, in general, a higher for longer scenario impose heavier headwinds for PDI than RCS. This is because PDI has longer duration profile, which in the case of falling interest rates puts a more significant drag on the share price. Plus, higher interest rates over more extended time period, increase the probability of corporates and households with weaker balance sheets to default on their debts. This, in combination with PDI’s notable external leverage, does not sound good.
Moreover, the current economy is characterized with higher odds of facing a slowdown. There are many leading economic indicators, which suggest this to be the case.
For example, due to restrictive monetary policy, the 10 – 2 year yield curve has become inverted, which, historically, has been precursor to a recessionary event. Also, both services and manufacturing PMIs exhibit patterns of negative rate of change, where the latter has already dropped in the recessionary territory (i.e., below 50).
These dynamics do not bode well for instruments such as PDI, which are exposed to junk credit and lower quality mortgages that are magnified with a notable amount of external leverage.
Conversely, RCS is relatively more protected from the overall economic slowdown and system-wide increase in the credit defaults, as the underlying portfolio mainly consist of stable, agency backed mortgages, which are largely isolated from the interest rate volatility. The second largest exposure, which is in IG and developed market credit, provides an extra cushion given that the underlying constituents exhibit lower credit risk.
Bottom line
While RCS is rather similar to PDI due to the presence of external leverage via reverse repos and notable investments in fixed income primarily via mortgage backed securities, their risk profiles are completely different.
Currently, the difference between offered yields is 240 basis (PDI 14.1% vs RCS 11.7%).
However, PDI is considerably more exposed to credit and interest rate risk, as it has higher duration and massive allocations in the non-agency backed securities, high yield credit and emerging market fixed income instruments.
In the context of surging interest rate environment and negative leading economic indicators, RCS is a far more better choice, where the benefits of its lower exposure to credit and interest rate risk outweigh the 240 basis point spread.
In my humble opinion, RCS is solid choice for investors, who seek juicy streams of current income that are less exposed to the risks of recessionary economy.
Credit: Source link