
Getty Images/Getty Images News
Introduction
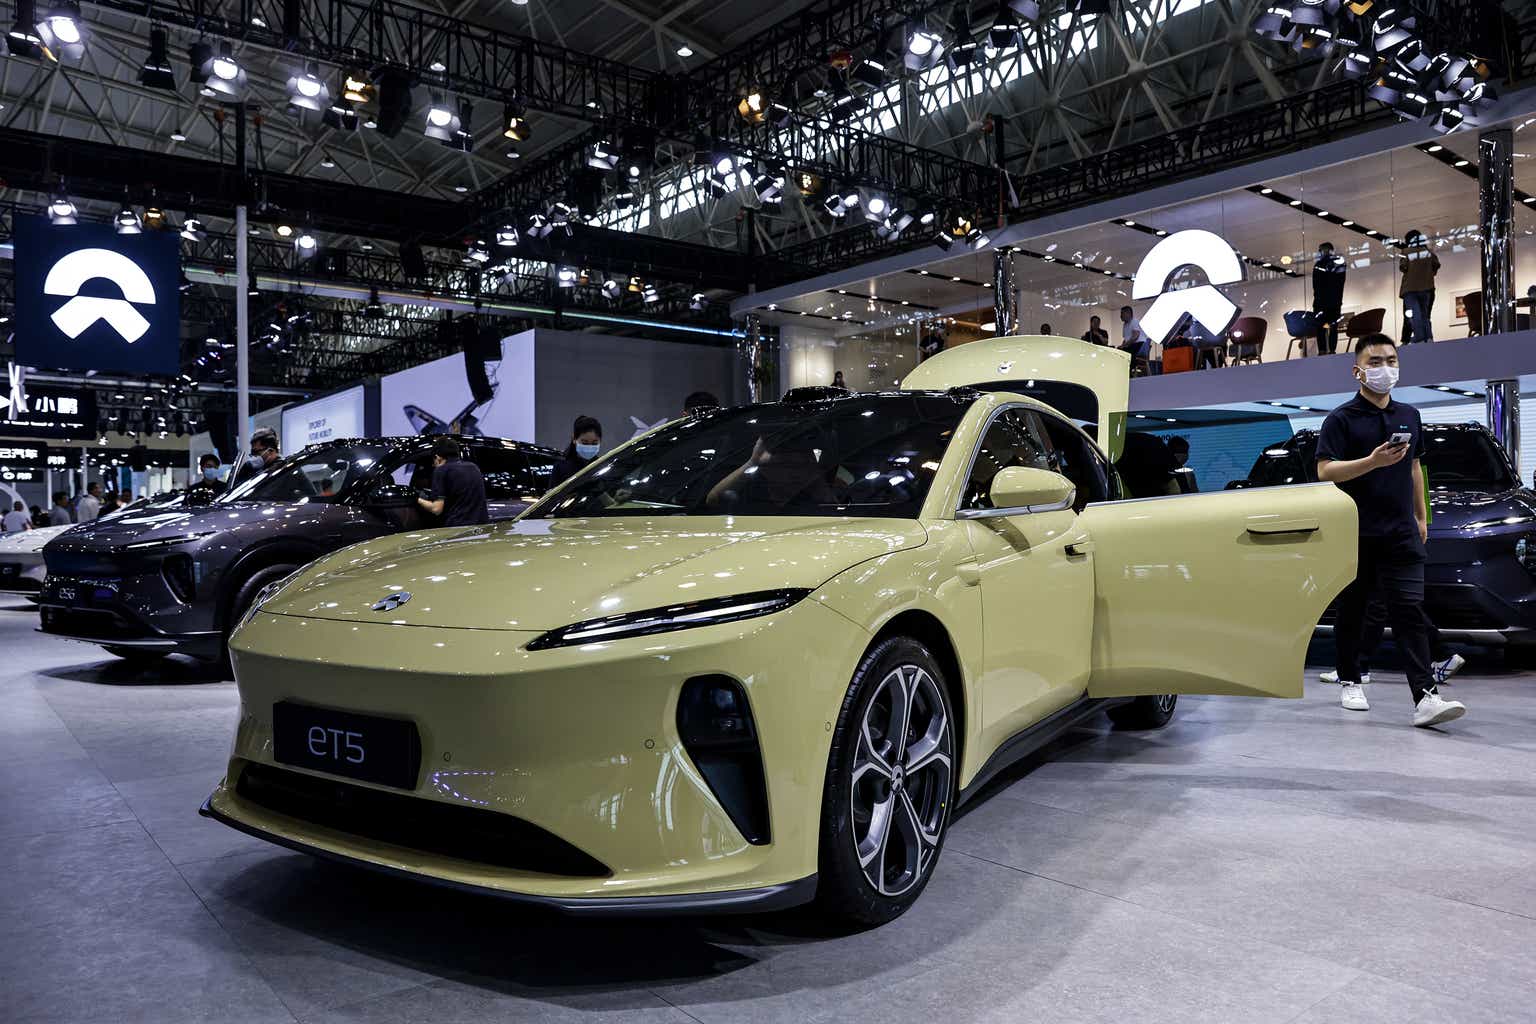
My thesis is that NIO (NYSE:NIO) faces challenges with consumer preferences, large competitors, pricing power and gross margins.
Much of the message from my December article remains true. NIO is increasing unit sales of high-end BEVs but the rate of increase has been mild relative to what we’ve seen from other OEMs in China.
At the time of this writing, RMB 1,000 is equivalent to about $140.
Consumer Preferences
A WSJ article by Greg Ip allows readers to visualize the fact that all of NIO’s new energy vehicles (“NEVs”) are battery electric vehicles (“BEVs”) while a little more than half of BYD’s (OTCPK:BYDDY) NEVs are plug-in-hybrid vehicles (“PHEVs”) instead of BEVs:
China NEVs (WSJ)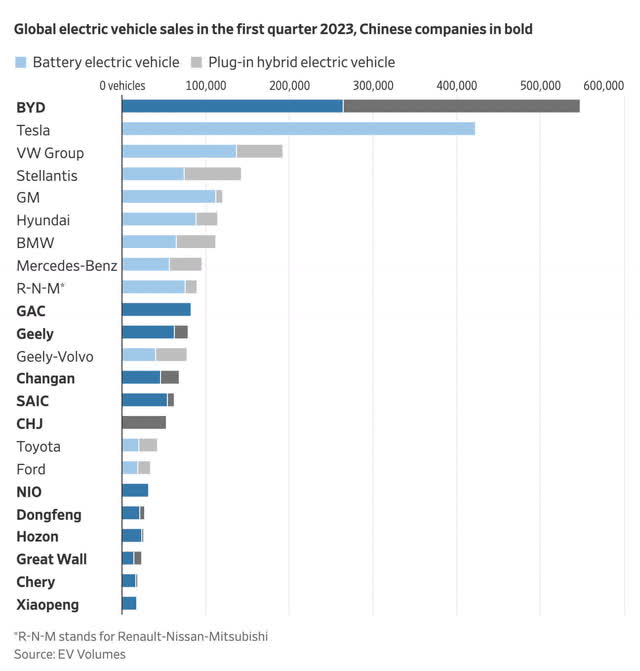
The NEV market is expanding in China and BEVs make up a bigger part of this market than PHEVs. Citing CAAM, the GAC 2022 Results Presentation shows sales of 19,977,000 vehicles in China for 2022. 6,887,000 of these were NEVs and nearly 80% of these NEVs were BEVs such that the BEV total was 5,365,000:
China BEVs (GAC 2022 Results Presentation)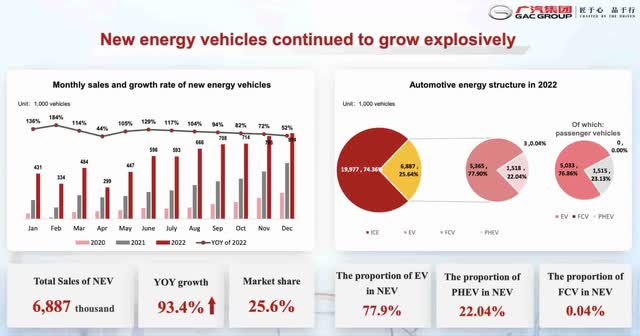
The NEV market is even bigger in 2023 but unfortunately for NIO, much of this increase is from PHEVs and low-end BEVs as opposed to high-end BEVs. A June article from CnEVPost talks about this:
Based on our analysis of the premium SUV market (>300k RMB), the BEV mix is only 12% YTD, compared with PHEV (includes EREV) at 18%, leaving 70% for ICE. This compares with the overall market that is 21% BEV and 10% PHEV, showing customer preferences are quite different depending on the sub-segment.
Said another way, CnEVPost is saying premium SUV NEVs are about 30% of the market so far in 2023 with the remainder being ICE and the NEV breakdown is 12% BEV and 18% PHEV. This compares to the overall NEV segment that is about 31% of the market with a breakdown that is 21% BEV and just 10% PHEV. This means companies like BYD that sell both BEVs and PHEVs at various price points have many sales opportunities that NIO does not.
Large Competitors
Given consumer preferences for high-end PHEVs over high-end BEVs above, large companies like BYD are advantaged with respect to NIO in terms of increasing unit sales. The growth of another large competitor, Tesla (TSLA), is more concerning than BYD in some ways because Tesla also offers high-end BEVs although the Tesla Model 3 is a little less expensive than the typical NIO vehicle. The CPCA shows that BYD and Tesla are outperforming everyone with January to May NEV sales of 923,343 units and 219,893 units, respectively. Their YoY growth rates are both over 80% which is especially impressive given the fact that they both started with large bases last year. Parts of the Google Translate text are hard to read below but the #5 position belongs to Geely Auto and NIO is way down at #10 with a YoY growth rate of 15.8% which is more modest:
China NEVs (CPCA)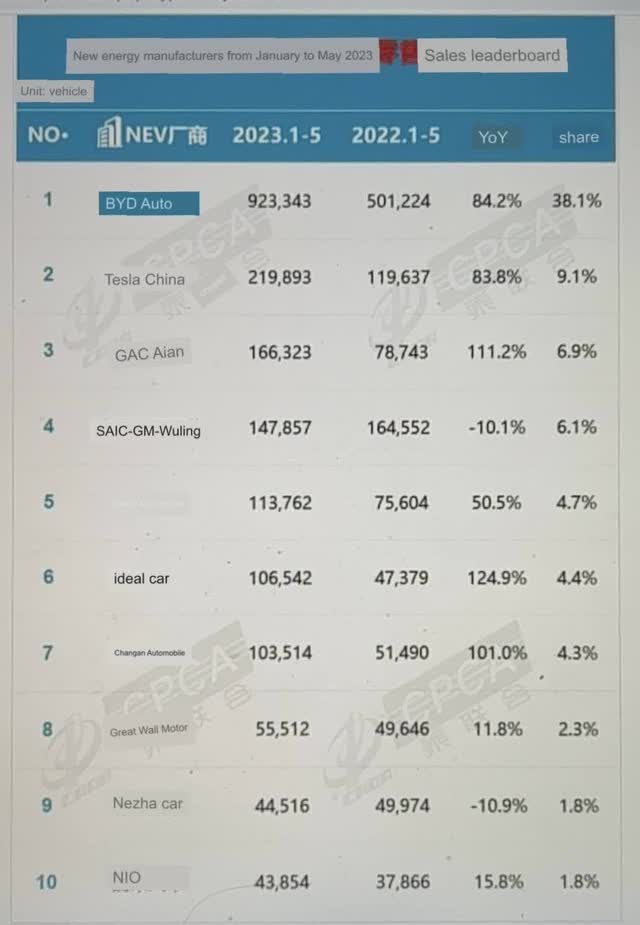
In addition to BYD and Tesla, NIO also has to contend with GAC Aion whose YoY growth rate is over 100%. SAIC-GM-Wuling is shown as #4 above but I don’t pay much attention to them seeing as most of their units are more like golf carts than automobiles. Geely Auto and Changan are #5 and #7 above and they are working together on electrification so this is yet another formidable interest.
Pricing Power
NIO’s 1Q23 announcement shows deliveries increased from 25,768 in 1Q22 up to 31,041 in 1Q23. However, vehicle sales on the income statement were fairly flat, going from RMB 9,244 million to RMB 9,224. Rounding to the nearest RMB 10,000, this comes out to about RMB 360 thousand per vehicle for 1Q22 and about RMB 300 thousand per vehicle for 1Q23. This decline in price is concerning:
NIO Income Statement (1Q23 announcement)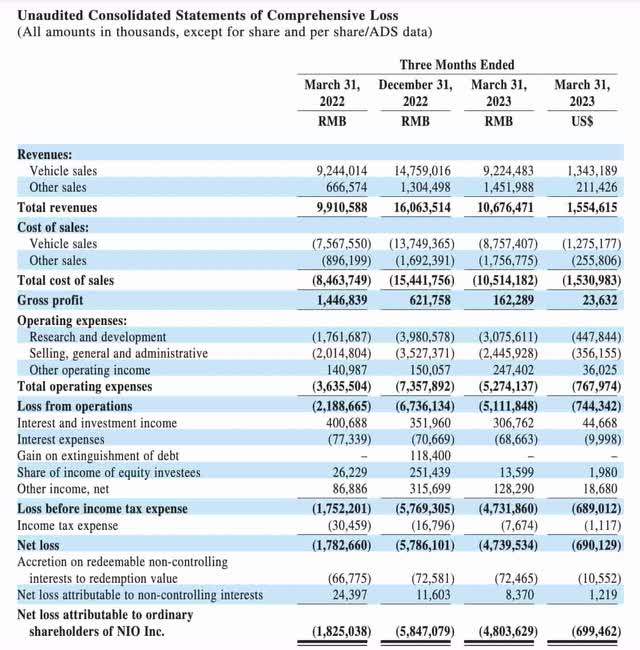
Gross Margin
Obviously the decline in sales price above hurts the gross margin. In addition, the 2022 annual report says the vehicle gross margin fell by about 3.8% in 2022 due to the increased battery cost per vehicle:
Vehicle margin in 2022 was 13.7%, compared with 20.1% in 2021. The decrease of vehicle margin as compared to 2021 was mainly driven by (i) the increased battery cost per vehicle with negative impact of around 3.8%, and (ii) the increased inventory provisions, accelerated depreciation on production facilities, and losses on purchase commitments for the existing generation of ES8, ES6 and EC6 which are expected to have lower production levels and deliveries due to their transition to new models under NT2.0, with a negative impact of 2.2% on vehicle margin.
Valuation
The 2022 annual report shows revenue climbing nicely from 2020 to 2021 and again from 2021 to 2022:
NIO Financials (2022 annual report)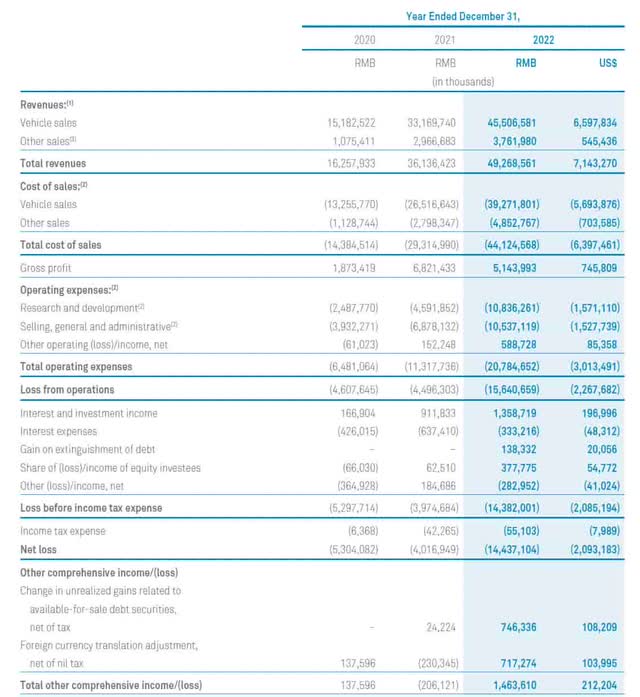
Unfortunately, revenue was fairly flat from 1Q22 to 1Q23. Trailing twelve-month (“TTM”) net loss, gross profit and revenue were RMB (17,394) million, RMB 3,859 million and RMB 50,034 million, respectively. This comes from RMB (4,740) million + RMB (14,437) million – RMB (1,783) million, RMB 162 million + RMB 5,144 million – RMB 1,447 million and RMB 10,676 million + RMB 49,269 million – RMB 9,911 million, respectively. This TTM revenue figure is equivalent to about $7 billion and it’s hard to say what NIO is worth given the net losses and the volatility of the gross profit. Additionally, JAC does the manufacturing for NIO so some of the economics are obfuscated. Finally, the viability of the battery as a service (“BaaS”) business is hard to predict.
The 1Q23 announcement uses 1,649,309,669 as the weighted average number of ordinary shares. Also, the 2022 annual report shows 1,719,105,680 shares outstanding as of December 31st made up of 1,570,605,680 Class A plus 148,500,000 Class C. Multiplying this by the June 16th share price of $9.40 gives us a market cap in excess of $16 billion.
I view NIO as a hold for now seeing as there are a large number of uncertainties that complicate the picture with respect to buying or selling.
Forward-looking investors should check the updates from the annual general meeting on June 26th.
Credit: Source link