

cbies
Intro
We wrote about B&G Foods, Inc. (NYSE:BGS) just over 13 months ago when we reaffirmed the downside risk which was inherent in this high-yielding dividend stock. Our premise was due to the technical damage on B&G’s long-term chart (resulting in shares being unable to recover their 200-day moving average), an expected earnings contraction, and high-interest payments which continue to pressure the financials.
However, we did not expect the carnage, resulting in shares losing almost 50% of their value over the past 13 months alone. As we see below, shares did try to recover their 200-day moving average in April of this year but unfortunately rolled over in May which was disappointing.
Therefore, given the sizable contraction in shares and given the company’s current dividend (despite having already been cut due to the carnage) yield of almost 6%, value investors may now be starting to size up B&G Foods from the long side. We though would only recommend 4 to 6-month swing plays (when the technicals stack up) and not a long-term investing strategy in B&G Foods as risk, unfortunately, remains abound. Here are some insights which back up our argument.
B&G Technicals (Stockcharts.com)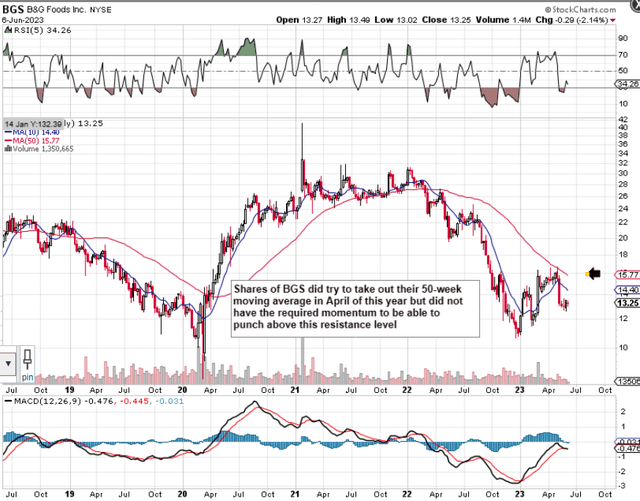
Dividend Pay-Out Ratio
Although many times stocks can actually perform better when a dividend cut is announced (Due to more cash flow being freed up), it is dangerous to bank on this assessment for the following reason. B&G back on the 9th of November last year announced a quarterly dividend cut of $0.48 per quarter per share to $0.19. Shares at the time were trading at about $14.65 per share but the announcement did little to steady the ship as shares finally bottomed out below $11 a share roughly six weeks post the announcement. Whether these lows will hold going forward remains to be seen but investors should ponder the following.
Despite the fact that the dividend was cut, the new quarterly payment of almost $14 million comes in at approximately $56 million if we annualize the cost. Now GAAP earnings in B&G over the past 12 months of -$31.6 million means the reduced dividend was not covered by earnings. Therefore, what long-term investors have to ask themselves here is if that 6% dividend yield was suspended in due course due to a liquidity crisis, could that 6% be made back on share-price capital gain? Lower lows on B&G’s long-term chart as well as negative earnings do not present confidence here from a long-term standpoint.
Lack Of Hard Assets
B&G’s stated shareholder equity of $861 million and market cap of $957 million means the company’s current price-to-book ratio comes in at 1.11. This multiple comes in considerably lower than B&G’s 5-year multiple of 1.88 as well as the sector’s 2.59. Although this discount may look attractive on the surface, it is imperative to view how equity is essentially made up.
For instance, intangible assets & goodwill make up $2.4+ billion, a significant percentage of the company’s total assets (64%). The problem with these line items is that their values can be revised downward when performance doesn’t come up to scratch. Write-downs or impairments immediately affect the financials and the net worth of the company. However, when a balance sheet contains plenty of cash and hard assets like property, plant, and equipment, write-downs are far fewer in nature. Incidentally, gross PPE & cash only comes to 22% of B&G’s asset base so investors can clearly see here how the lion’s share of the company’s asset base is currently set up.
Very High Leverage
At the end of B&G’s most recent Q1 report, the company reported $2.28 billion of long-term debt on its balance sheet. This means the reported debt-to-equity ratio comes in at 2.64 but again investors must size up the ‘quality’ of B&G’s equity when evaluating this ratio. Furthermore, to give you an idea of how much this leverage is costing B&G, the company’s interest expense almost hit $40 million in Q1 this year which when annualized comes in at close to $160 million for a full fiscal year. Suffice it to say, when one takes the company’s dividend & interest payments into account, the question then becomes how will B&G be able to continue to invest behind its company when its profitability numbers at present are so poor.
Conclusion
To sum up, B&G’s long-term bearish technicals, profitability woes, and balance sheet concerns are numerous reasons why B&G should not be bought here solely because of its valuation and almost 6% dividend yield. Let’s see what Q2 brings. We look forward to continued coverage.
Credit: Source link