


Finance background honglouwawa
2023 continues to be a year of uncertainty for the dollar as market optimism regularly comes into conflict with persistent Fed interest rate rises. With new base rate hikes becoming likely for mid-June, the USD has swung into locally overbought territory.
Despite experiencing some degree of volatility throughout recent weeks, the dollar has ended May fighting its way to gains of 3.4% from its lows at the beginning of the month.
US Dollar Index (MarketWatch)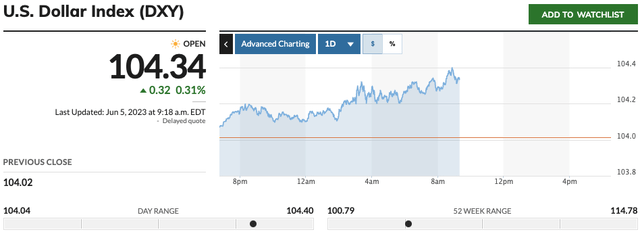
As USD price movements throughout 2023 show, the dollar has actually struggled to maintain its value from the beginning of the year, owing to lingering inflation, combative interest rate rises, and concerted efforts from some global nations to decouple from USD. With it continuing to range around the 104-105 mark, the currency is showing fair strength despite sitting relatively low within its 52-week range. Recent moves higher have seen the dollar enter overbought territory, and zooming out into a longer-term picture, we can see that the overall trend for USD remains a downward one.
US Dollar Index (MarketWatch)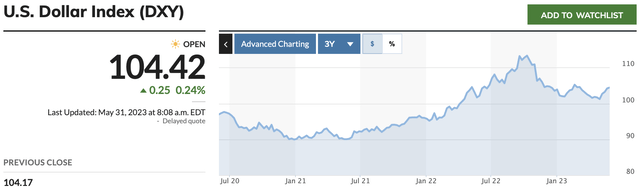
This downward trend was sparked when traders became aware of the full extent of the upcoming interest rate hikes from the Federal Reserve. Now, traders looking to keep USD’s long-term trend in mind could look for a bearish price reversal before the currency reaches its next resistance level for an indication of an end to the ongoing rebound.
Such a move could open up a credible short entry on the dollar index, and we may see USD bump into a resistance barrier sooner rather than later.
Pivot On The Way?
When consulting the Relative Strength Index (RSI) indicator on USD’s daily chart, we can see that the dollar has been steadily retreating towards 55 after climbing to 70 early on May 31, 2023. This indicates that the US Dollar Index (DXY) may be embarking on a market correction, rather than moving into bearish territory.
US Dollar Index (SeekingAlpha)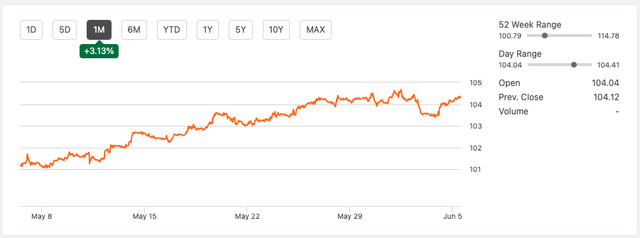
Still, 103-104 reflects a key technical level, and should a daily close below this figure occur, we may see a flurry of USD sellers that will manifest into a more sustained decline towards 102-103-which is where the 100-day Simple Moving Average is located.
Should 103-104 stand firm as support, it could cause renewed buyer interest. With a bullish cross in the view from both the 20-day and 50-day Simple Moving Averages (SMAs), it may be the case that USD shows strength in the face of its ‘overbought’ indicator instead. However, the key pivot level here is likely to come in the 105 range. The psychological and static level of 105.00 will present itself as a major test for the dollar, while 105.60 represents a Fibonacci 38.2% retracement and a 200-day SMA.
Factoring Fed Uncertainty in Forex
Although USD was performing relatively well in late May, the major factor for forex traders in this circumstance will be the prospect of upcoming interest rate increases from the Federal Reserve. FxPro senior market analyst Alex Kuptsikevich has suggested that the chances of another Fed rate hike occurring in the June 13-14 meeting sit at around 64%. At the beginning of the dollar’s early May high performance, this percentage was close to zero. The prospect of another rate hike may help to attract capital back into USD after many traders left following the high-profile collapse of Silicon Valley Bank and other regional banking crises. In my opinion, the short-term fate of the market may receive a boost from the Fed adopting a more measured approach in the coming weeks. With the banking crisis at the beginning of the year showing signs of a faster recovery, the need for intervention may be less desperate.
Despite this, Federal Reserve Bank of St. Louis President James Bullard stated that two more base rate rises could still come in 2023. However, whether or not a pause to the continuous hikes will happen in June is still largely unclear. Should this be the case, I believe that the dollar may undergo a correction that could lead to a retest of the lower boundary of its 52-week range at 100.79. However, should a more cautious outlook be favored, we’re likely to see USD challenge March’s peak support level at 105.80.
USD/JPY Chart (MetaTrader 5)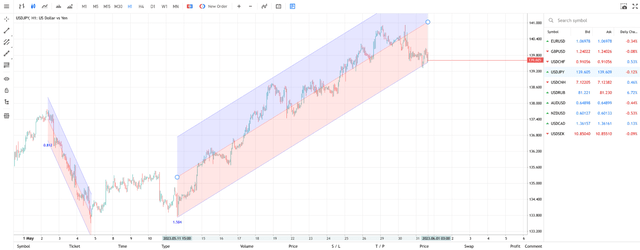
Using MetaTrader 5’s terminal and USD/JPY as our chart, we can see that USD recovered relatively quickly following a steep regression from the previous Federal Reserve announcement on May 3, 2023, regarding further interest rate hikes, which climbed to a 16-year high at the time. As confidence returned to USD, we can see a positive trend emerged in comparison to yen, which remained firm until May 30, 2023. In the days that have followed, USD/JPY has fallen below its regression line as its key pivot level approaches.
This can be a disappointing trend for traders. The dollar had briefly surpassed a psychological 140 barrier for the first time since November 17, 2022, in a show of strength against Japan’s currency. However, this loss of traction came even after three consecutive weeks of price rallies. It is thought that this reversal came in the wake of growth prospects of a debt ceiling deal which interrupted demand for safe-haven assets and increased investor appetite for riskier opportunities.
In monitoring the future movements of the dollar, it’s worth traders keeping in mind technical analysis tools like Fibonacci sequences to view how the dollar approaches a prospective 38.2% Fibonacci retracement at 105.60. This can be easily done on MT4 and MT5 by inserting and drawing out a Fibonacci retracement using the platform’s drop-down list of objects. This may lead to a more comprehensive understanding of how the currency will measure up to the pressure of June’s upcoming Fed meeting.
Anticipating the Whims of the Fed
While much of the movements of USD will boil down to the state of interest in the US following a prospective rate hike in mid-June, the dollar is still ready to fight its own battles as it approaches a major pivot level. In encountering these challenges, investors can gain invaluable insight into the relative strength and future prospects of the dollar in comparison to pairings like USD/EUR and USD/JPY.
In utilizing the right technical analysis to determine the strength of the dollar, traders may find invaluable insights throughout the month of June in how the rest of the year could look for USD. 105 remains a significant hurdle, but the Fed’s June meeting will be seismic as an indicator for the currency’s 2023 prospects.
Editor’s Note: This article covers one or more microcap stocks. Please be aware of the risks associated with these stocks.
Credit: Source link


