• bitcoinBitcoin(BTC)$78,319.001.75%
  • ethereumEthereum(ETH)$2,305.351.39%
  • tetherTether(USDT)$1.000.02%
  • rippleXRP(XRP)$1.390.94%
  • binancecoinBNB(BNB)$615.92-0.09%
  • usd-coinUSDC(USDC)$1.000.01%
  • solanaSolana(SOL)$83.79-0.10%
  • tronTRON(TRX)$0.3287860.76%
  • Figure HelocFigure Heloc(FIGR_HELOC)$1.030.14%
  • dogecoinDogecoin(DOGE)$0.108053-0.10%
  • whitebitWhiteBIT Coin(WBT)$58.451.27%
  • USDSUSDS(USDS)$1.000.01%
  • HyperliquidHyperliquid(HYPE)$41.544.11%
  • leo-tokenLEO Token(LEO)$10.330.13%
  • cardanoCardano(ADA)$0.247706-0.34%
  • bitcoin-cashBitcoin Cash(BCH)$449.411.46%
  • moneroMonero(XMR)$387.381.45%
  • chainlinkChainlink(LINK)$9.09-0.51%
  • zcashZcash(ZEC)$378.098.30%
  • CantonCanton(CC)$0.1514080.35%
  • stellarStellar(XLM)$0.1595200.39%
  • USD1USD1(USD1)$1.00-0.01%
  • daiDai(DAI)$1.000.06%
  • litecoinLitecoin(LTC)$55.450.41%
  • avalanche-2Avalanche(AVAX)$9.100.12%
  • Ethena USDeEthena USDe(USDE)$1.000.01%
  • hedera-hashgraphHedera(HBAR)$0.0878970.23%
  • RainRain(RAIN)$0.007808-0.45%
  • shiba-inuShiba Inu(SHIB)$0.000006-1.45%
  • suiSui(SUI)$0.920.69%
  • MemeCoreMemeCore(M)$2.83-10.34%
  • the-open-networkToncoin(TON)$1.32-1.27%
  • paypal-usdPayPal USD(PYUSD)$1.00-0.01%
  • crypto-com-chainCronos(CRO)$0.0683760.21%
  • Circle USYCCircle USYC(USYC)$1.120.00%
  • tether-goldTether Gold(XAUT)$4,599.930.41%
  • BittensorBittensor(TAO)$276.768.38%
  • Global DollarGlobal Dollar(USDG)$1.000.02%
  • BlackRock USD Institutional Digital Liquidity FundBlackRock USD Institutional Digital Liquidity Fund(BUIDL)$1.000.00%
  • pax-goldPAX Gold(PAXG)$4,602.820.48%
  • mantleMantle(MNT)$0.630.06%
  • uniswapUniswap(UNI)$3.210.12%
  • polkadotPolkadot(DOT)$1.200.06%
  • SkySky(SKY)$0.0813320.81%
  • Pi NetworkPi Network(PI)$0.179157-0.34%
  • Falcon USDFalcon USD(USDF)$1.000.01%
  • okbOKB(OKB)$83.460.64%
  • World Liberty FinancialWorld Liberty Financial(WLFI)$0.054820-9.34%
  • AsterAster(ASTER)$0.660.30%
  • nearNEAR Protocol(NEAR)$1.29-0.34%
TradePoint.io
  • Main
  • AI & Technology
  • Stock Charts
  • Market & News
  • Business
  • Finance Tips
  • Trade Tube
  • Blog
  • Shop
No Result
View All Result
TradePoint.io
No Result
View All Result

S&P 500: Genuine Breakout? – Week Starting 5th June (Technical Analysis) (SP500)

June 4, 2023
in Market & News
Reading Time: 5 mins read
A A
S&P 500: Genuine Breakout? – Week Starting 5th June (Technical Analysis) (SP500)
ShareShareShareShareShare

cemagraphics

YOU MAY ALSO LIKE

What to know about May Day demonstrations as workers face rising energy costs due to Iran war – AP News

Americans remain critical of Trump administration’s approach to Iran – Pew Research Center

A dip early in the week gave bulls the chance to get long for the breakout. As last week’s article concluded, “…prepared with a bias, targets and important levels, the market should present opportunities.” My tweet on Wednesday hopefully helped as it pointed out a potential bottom at 4163 (the bottom came 10 minutes later at 4166).

Next week will present more opportunities and it’s again time to prepare. A variety of technical analysis techniques will be used to look at probable moves for the S&P 500 (SPY) in multiple timeframes. I will then use the evidence make a call for the week ahead.

S&P 500 Monthly

The May candle closed at 4179, which was close enough to the 4166 open to be considered a ‘doji’. June’s higher high has already negated its bearish potential and any reversal pattern will need to time to develop. At this early juncture, this simply mean staying above the 4183 June open.

SPX Monthly

SPX Monthly (Tradingview)

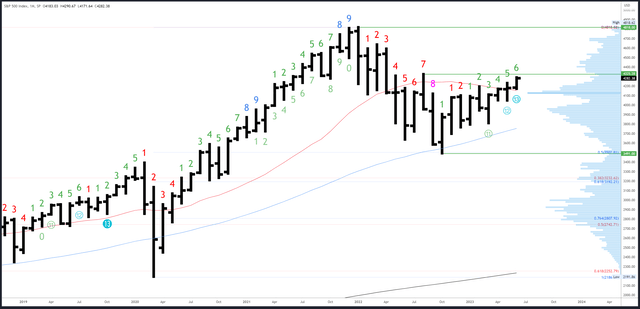
Resistance is at 4325 and the high of August, then the 4500 area.

It’s taken a long time to break 4195-200 and it ideally now acts a floor. The VPOC at 4130 is the next support below.

An upside Demark exhaustion count is on bar 6 (of 9).

S&P 500 Weekly

This weeks bar is not to be second-guessed and looks like a true break-out/range expansion after extended coiling and consolidation.

The close at 4282 was near enough to the 4290 weekly high to expect immediate follow above 4290 early next week.

SPX Weekly

SPX Weekly (Tradingview)

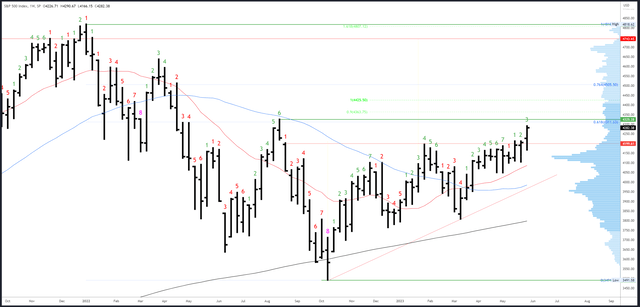
The next major targets are the 61% Fib retrace of the 2022 bear market at 4311, with the August high of 4325 just above. There’s not too much resistance above that until 4500, but I have my eye on 4363 due to the measured move there.

4195-200 is the first support, then 4166 and 4098.

The upside (Demark) exhaustion count will be on bar 4 (of 9) next week.

S&P 500 Daily

The inverse head and shoulders pattern has now played out to its target of 4280. We can now focus on the higher timeframe targets in play.

Friday’s strong close should lead to at least a new high over 4290 before any reversal pattern can form. As mentioned earlier, 4311-25 is the first area of interest and price would then need to break back through 4231-41 to signal weakness.

SPX Daily

SPX Daily (Tradingview)

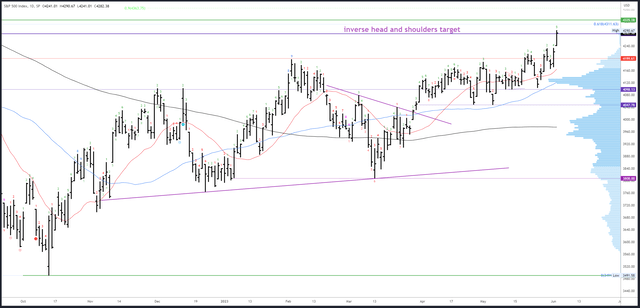
4231-41 is support created by Friday’s continuation gap and it is worth revisiting the two different gaps created this week as I touched on the subject in my last article.

SPX Gaps

SPX Gaps (Tradingview)

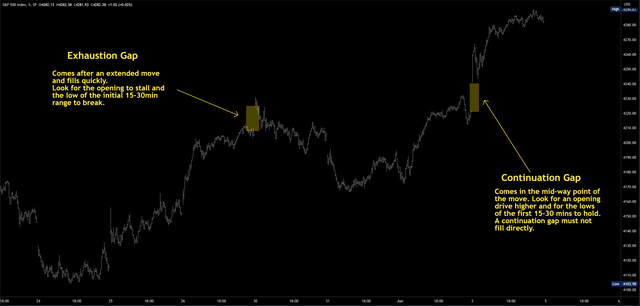
An upside Demark exhaustion count will be on bar 6 (of 9) on Monday. A reaction is expected on bar 8 or 9 so look out for a pause / dip from Wednesday onwards.

Events Next Week

Markets are now working on the assumption the Fed will pause in June which now has around a 75% probability according to the CME Fedwatch tool. No scheduled events or data next week are likely to change this situation and the Fed has just started its blackout period. CPI is the next ‘big’ release on the 14th June, the day before the FOMC meeting.

The resolution of the debt ceiling crisis means the Treasury General Account can be increased with new debt, potentially causing a drain on liquidity. To be honest, I don’t know the impact or timeframe for this driver, and I doubt many do, at least in the context of near-term price action. I therefore revert to what I know, and the Demark exhaustion signal could have a similar effect i.e. a liquidity

Probable Moves Next Week

A higher high above this week’s 4290 high is likely but should fade again. Markets have recently followed a pattern of reversing lower on Mondays, dipping into a mid-week bottom and then rallying into a strong weekly close. I will therefore look for another exhaustion gap on Monday similar to the one described above. 4311-25 remains the ideal target, and even when/if this is tested, the upper support area of 4267-71 could hold for consolidation and further highs to 4363.

Only a break of 4231 would dent the bullish momentum. If this happens directly (i.e. without a move to 4363 first), I wouldn’t consider the top to be in, but I would need to re-evaluate before trying to get long again. This could be late next week so it’s hard to foretell how things will line up when I’m writing this on a Saturday afternoon. 4195-200 is the first decent support on the higher timeframes.


Credit: Source link

ShareTweetSendSharePin

Related Posts

What to know about May Day demonstrations as workers face rising energy costs due to Iran war – AP News
Market & News

What to know about May Day demonstrations as workers face rising energy costs due to Iran war – AP News

May 2, 2026
Americans remain critical of Trump administration’s approach to Iran – Pew Research Center
Market & News

Americans remain critical of Trump administration’s approach to Iran – Pew Research Center

May 2, 2026
Top AI companies agree to work with Pentagon on secret data – The Washington Post
Market & News

Top AI companies agree to work with Pentagon on secret data – The Washington Post

May 2, 2026
FDA expands access to a promising drug for one of the worst cancers – The Washington Post
Market & News

FDA expands access to a promising drug for one of the worst cancers – The Washington Post

May 1, 2026
Next Post
Yen Has Further to Fall, Gold Rally Not Done

Yen Has Further to Fall, Gold Rally Not Done

Leave a Reply Cancel reply

Your email address will not be published. Required fields are marked *

Search

No Result
View All Result
LIVE NOW: APPLE & SANDISK EARNING REPORT 2026

LIVE NOW: APPLE & SANDISK EARNING REPORT 2026

May 1, 2026
Humanoid robots take over manual job at auto parts plant

Humanoid robots take over manual job at auto parts plant

April 28, 2026
Why DeepSeek V4 Impresses Despite Lack of ‘Wow’ Factor

Why DeepSeek V4 Impresses Despite Lack of ‘Wow’ Factor

April 28, 2026

About

Learn more

Our Services

Legal

Privacy Policy

Terms of Use

Bloggers

Learn more

Article Links

Contact

Advertise

Ask us anything

©2020- TradePoint.io - All rights reserved!

Tradepoint.io, being just a publishing and technology platform, is not a registered broker-dealer or investment adviser. So we do not provide investment advice. Rather, brokerage services are provided to clients of Tradepoint.io by independent SEC-registered broker-dealers and members of FINRA/SIPC. Every form of investing carries some risk and past performance is not a guarantee of future results. “Tradepoint.io“, “Instant Investing” and “My Trading Tools” are registered trademarks of Apperbuild, LLC.

This website is operated by Apperbuild, LLC. We have no link to any brokerage firm and we do not provide investment advice. Every information and resource we provide is solely for the education of our readers. © 2020 Apperbuild, LLC. All rights reserved.

No Result
View All Result
  • Main
  • AI & Technology
  • Stock Charts
  • Market & News
  • Business
  • Finance Tips
  • Trade Tube
  • Blog
  • Shop

© 2023 - TradePoint.io - All Rights Reserved!