


")

DNY59/E+ via Getty Images
The AI Investment Thesis Is Too Volatile At These Heights
NVDA 2Y Stock Price
TradingView
It appears that the market and investors alike have chosen to be somewhat irrational again, pushing NVIDIA Corporation (NASDAQ:NVDA) to its highest-ever stock price of $401.11 at the time of writing.
Either way, the rally is partly attributed to the hype surrounding artificial intelligence, or AI, since the launch of ChatGPT in November 2022, further boosted by the management’s stellar FQ1’24 double beats and FQ2’24 forward guidance.
NVDA has guided an eye-popping revenue of $11B (+52.9% QoQ/ +64.1% YoY) for the next quarter, well exceeding the consensus estimates by +54.7%. This is on top of the expanding GAAP gross margins of 68.6% (+4 points QoQ/ +25.1 YoY) and GAAP operating income of approximately $4.83B (+125.7% QoQ/ +867.9% YoY).
These numbers deserve applause indeed, as evidenced by the massive pop in its stock prices. Based on CEO Jensen Huang’s commentary here, it seems that the age of CPUs may finally be over, with the insatiable demand for generative AI and computing capacity triggering the redesign of data centers toward GPUs.
NVDA’s Head & Shoulder Pattern In 2021/ 2022
TradingView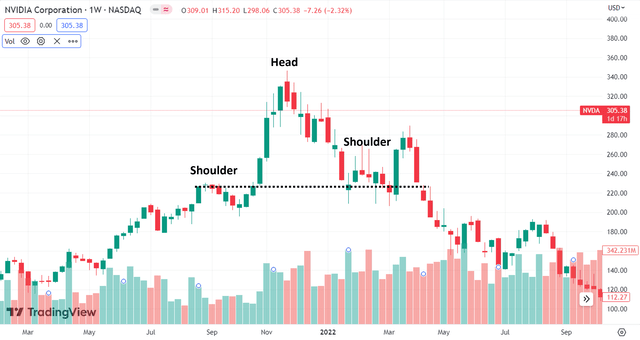
However, here is where we prefer to exercise caution. This cadence is highly reminiscent of NVDA’s previous head and shoulder pattern in November 2021, with it reaching its peak within a short period of time and a plunge occurring after the optimism is moderated.
While we remain optimistic about the AI supercycle, it is uncertain if NVDA’s jump in demand is sustainable over the next few years, supporting its stock’s new heights at a time of recession. With the stock bordering overvaluation, there may be a minimal margin of safety for adding here, in our view.
Then again, part of the enthusiasm may be attributed to the early recovery in NVDA’s other offerings, including the Gaming segment at $2.24B (+22% QoQ/ -38% YoY), Professional Visualization at $295M (+31% QoQ/ -53% YoY), and Automotive at $296M (+1% QoQ/ +114% YoY) for the latest quarter.
We must also highlight that the latter now boasts a design win pipeline of $14B (+27.2% YoY) through 2029, with the world’s largest electric vehicle (“EV”) maker by volume, BYD Company Limited (OTCPK:BYDDY), set to adopt NVIDIA Drive Orin across its next generational series. With BYD projected to achieve EV sales of up to 10M by 2030, at an accelerated CAGR of 23.40%, we believe NVDA’s partnership with the former may trigger a robust automotive tailwind ahead.
Now, back to NVDA’s AI strategy, it records an exemplary data center revenue of $4.28B (+18.2% QoQ/ +14.1% YoY), thanks to the growing demand for generative AI. It appears that the latter is also outstripping supply, with the management “significantly increasing supply to meet surging demand” for its entire data center family of products.
It appears that the Jensen-Huang-led company is aggressively eating its competitors’ lunch by the latest quarter as well. Both Advanced Micro Devices, Inc. (NASDAQ:AMD) and Intel Corporation (NASDAQ:INTC) reported underwhelming data center performances at revenues of $1.29B (-21.8% QoQ/ inline YoY) and revenues of $3.7B (-39.3% QoQ/ -13.9% YoY), respectively.
Due to this cadence despite the flattish capex spend by many tech/ cloud companies, it may be safe to surmise that NVDA may further grow its market share in the discrete GPU market beyond the latest report of 85% in FQ4’22 (-1 point QoQ/ +7 YoY). This further proves its semi/SaaS dominance and branding in the next semiconductor supercycle.
NVDA 3Y EV/Revenue and P/E Valuations
S&P Capital IQ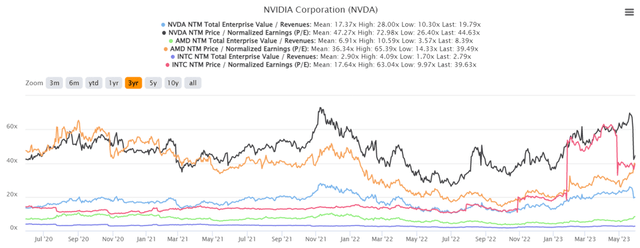
However, does this mean that NVDA deserves its valuation? Let’s compare it to its peers. The stock has recorded a new optimism in its already premium metrics, at EV/NTM Revenue of 19.79x and NTM P/E of 44.63x at the time of writing, against its 1Y mean of 16.03x and 44.85x, respectively. Notably, the recent peak of 26.03x and 69.72x is already near the stock’s previous November 2021 peak of 28x and 72.98x, respectively.
Compared to its peers’ valuations, the stock is also expensive, suggesting Mr. Market’s growing confidence in its forward execution/ high-growth cadence, despite the economic downturn.
In addition, the consensus estimates have already raised their NVDA estimates tremendously, to a top and bottom-line CAGR of 32.2% and 54.1% through FY2026 (CY2025), against the previous estimates of 20.6% and 54.9% respectively. These numbers are also notably accelerated against the hyper-pandemic cadence of 35.2% and 15.5% between FY2020 (CY2019) and FY2023 (CY2022).
Assuming that the Jensen Huang-led company is able to match the analysts’ lofty expectations over the next two years, we suppose the baked-in premium may be well worth it, supporting its accelerated computing and generative AI narrative.
On the one hand, we may safely assume a nearly doubled EPS to $1.80 in FQ2’24 and H2’24, due to the tremendous expansion in its operating income, with NVDA potentially generating a stellar adj EPS of $6.49 in FY2024 (+94.3% YoY), as highlighted by Colette Kress, the CFO of NVDA:
So when we talk about our sequential growth that we’re expecting between Q1 and Q2, our generative AI large language models are driving the surge in demand, and it’s broad-based across both our consumer Internet companies, our CSPs, our enterprises, and our AI start-ups… This demand has extended our data center visibility out a few quarters and we have procured substantially higher supply for the second half of the year. (Seeking Alpha)
On the other hand, immense expectations may also trigger immense disappointments if NVDA fails to deliver against the consensus’ heightened estimates, potentially triggering another flight to safety sell-off moving forward.
With a replacement cycle of every three years, we suppose the sudden boom in demand for generative AI and HPC chips may also be moderated rapidly to its historical trend, one that we have observed after the massive pull-forward demand for personal devices/ PCs during the remote work cadence in 2020 and 2021.
As a result of the minimal upside potential to our price target of $389, based on our aggressive FY2024 EPS projection and a normalized P/E of 60x, we prefer to rate the NVDA stock as a Hold for long-term investors.
We do not recommend anyone to chase the Nvidia Corporation rally here, since doing so naturally increases their dollar cost averages. Meanwhile, we have also taken some gains off the table to rebalance our portfolio here, since it is too early to tell if NVDA may sustain this momentum in the AI chips market.
Many other competitors such as Microsoft Corporation (MSFT), Google (GOOG, GOOGL), Amazon (AMZN), and Intel are already entering the intense AI chips competition, as highlighted in our previous AMD article here. Therefore, any market share losses may trigger further volatility in Nvidia Corporation’s stock prices, in our view.
Editor’s Note: This article discusses one or more securities that do not trade on a major U.S. exchange. Please be aware of the risks associated with these stocks.
Credit: Source link


 2026-04-28")


