
TexPhoto/E+ via Getty Images
Introduction
In this article, I want to do at least two things:
- Cover a natural gas stock I have never covered before.
- Discuss the important fundamentals of the natural gas industry.
In this case, I’m covering Texas-based Range Resources Corporation (NYSE:RRC). This company is one of the most well-run natural gas players in North America, with deep, high-quality reserves, efficient operations in the Appalachian basin, and a valuation that could benefit tremendously from what I believe will be a prolonged (albeit volatile) long-term natural gas bull case.
So, without further ado, let’s dive into the details!
What Makes Range Resources So Special
So far, I have covered every major single natural gas driller except for the company behind the RRC ticker.
With a market cap of $6.6 billion, Fort Worth-based natural gas driller Range Resources is one of America’s largest natural gas drillers.
The company operates in the Marcellus Shale in Pennsylvania, where it has more than 30 years’ worth of inventory – most of it at extremely low breakevens.
Range Resources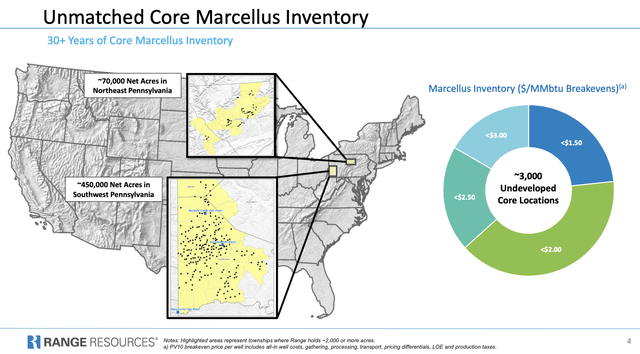
The company’s inventory is a big benefit, as a lot of oil and gas producers without high-quality inventories have to engage in (often risky) M&A projects to maintain inventory for a healthy production outlook. Especially in the current environment where high-quality inventories are running out of steam, this is a pressing issue.
Based on that context, with over 3,000 locations boasting breakevens below $3.00 per MMBtu, the company is a highly efficient operator. Moreover, approximately 2,500 of these locations have breakevens below $2.50, outperforming many competitors and their profitability thresholds.
This remarkable achievement not only ensures a robust free cash flow for the company, but also acts as a safeguard against potential risks. When peers find themselves unable to turn a profit, they often scale back production, providing upside support for natural gas prices.
Range Resources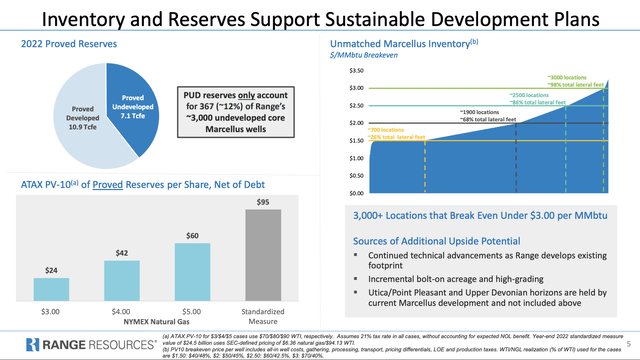
Even better, the company’s operations and reserves in the Marcellus allow it to drill at subdued costs, providing much-needed affordable natural gas to support issues like job creation, national security benefits, and reductions in CO2 emissions.
Currently, natural gas accounts for 40% of the US electricity mix – and growing.
Range Resources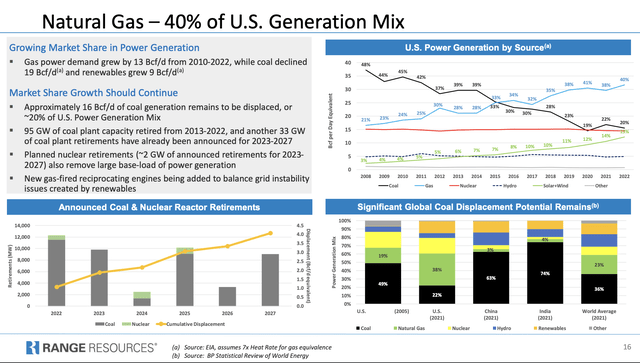
RRC’s productions almost exclusively consist of natural gas and natural gas liquids. In the first quarter, the company produced 1.5 billion cubic feet of natural gas per day. It produced roughly 6,400 barrels of oil per day and 103 thousand barrels of natural gas liquids. When translating all of this to a natural gas equivalent, the company’s production consists of 71% natural gas.
Furthermore and with regard to its efficient operations, in the first quarter, the company completed over 600 frac stages on three pads in different areas, maintaining efficiencies with an average of eight stages per day.
Completion efficiencies continued to improve in late Q1 and into Q2, averaging over nine stages per day. The company highlighted a pad currently being completed as one of the most efficient paths in Range’s history.
According to the company, these incremental improvements support Range’s peer-leading capital efficiency and contribute to the company’s strong well productivity.
None of its peers beat RRC when it comes to capital efficiency. This includes CapEx reinvestment rates to maintain operations.
Range Resources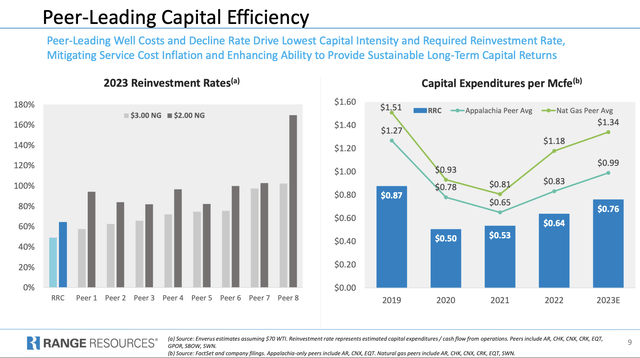
Furthermore, these numbers indicate that RRC is attractively valued. As the second slide in the article showed, the company has a PV-10 of $42 at $4.00 NYMEX Henry Hub.
Essentially, PV-10 is a calculation of the present value of estimated future oil and gas revenues, net of forecasted direct expenses, and discounted at an annual rate of 10%. Given that RRC shares are trading at 27, the company is trading well below its PV-10 at somewhat elevated natural gas prices.
The Company’s Debt Reduction & Shareholder Focus
Like most of its peers, RRC was a hot mess prior to the pandemic. Shareholders lost almost everything between the 2014 oil and gas peak and the depth of the 2020 pandemic.
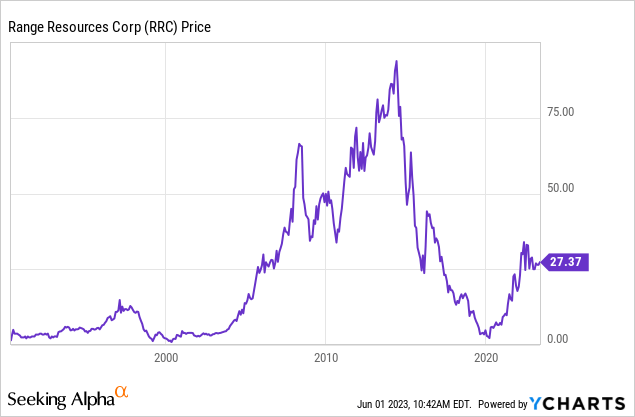
During this decline, RRC and its peers had elevated debt levels and suffered from self-inflicted pain through rapidly rising supply. The moment demand weakened, natural gas prices fell into a bottomless pit.
Now, the company is using more favorable market conditions to reduce its debt load.
RRC follows a cash flow allocation strategy that prioritizes specific areas.
The first priority is maintenance capital expenditures to leverage existing infrastructure and maximize margins.
The second is reducing debt levels to reach the target range of $1 billion to $1.5 billion in net debt.
The third priority is returning capital to shareholders, while the fourth priority is allocating funds to growth capital expenditures when appropriate.
This strategy provides flexibility to allocate resources based on the highest overall returns for the company and its shareholders.
RRC has been successful in reducing its debt over the years and is now close to entering the target debt range. With a current leverage ratio of 0.8x debt to EBITDAX, RRC is well-positioned to create value on a stable financial base throughout various business cycles.
Range Resources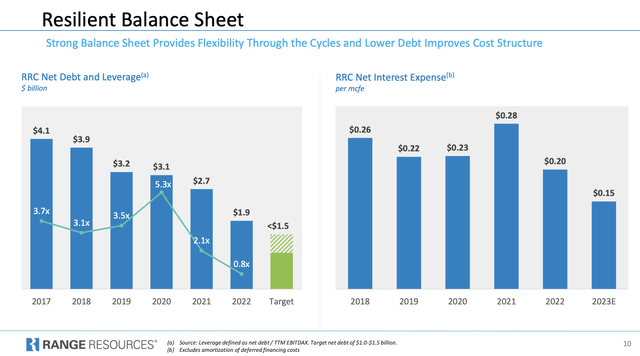
Furthermore, the company applies a thorough hedging strategy to protect its income against (temporary) price declines.
For the remaining three quarters of this year, the company has hedged 44% of its natural gas production and roughly 70% of its oil production. These hedges have a floor of $3.48 and a ceiling of $4.10, which means the company is currently in a good spot.
For 2024, the company has hedged 35% of its production.
Range Resources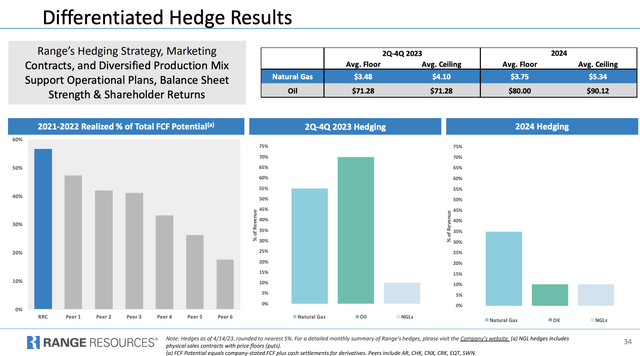
Despite its hedges, the company has high free cash flow realization, which means it doesn’t waste money on hedges – it has an efficient hedging strategy. Also, given the numbers above, the company is a more efficient hedger than its major peers.
Where’s The Value?
Right now, natural gas prices aren’t doing so well.
Henry Hub spot prices are trading close to $2.0 (per MMBtu), which is one of the lowest levels since the pandemic.
TradingView (RRC, NYMEX Henry Hub)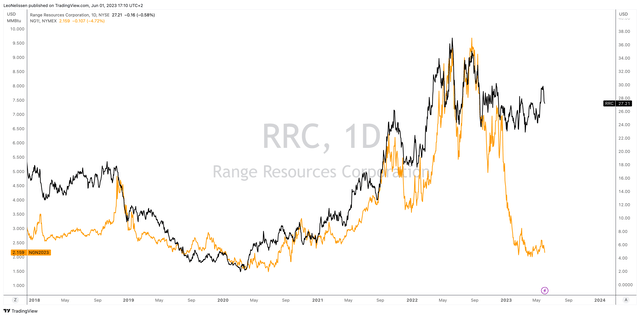
However, RRC shares continue to trade at elevated prices – at least when compared to natural gas prices.
What most traders cannot see is that prices further down the curve are elevated. This is also what caused Bank of America (BAC) analysts to turn bullish on natural gas drillers.
As reported by the Wall Street Journal, natural gas scheduled for delivery in June is priced at around $2.50 per MMBtu. In contrast, the prices for June 2024 and June 2025 gas are approximately 35% and 57% higher, respectively.
This is what the curve looks like:
Wall Street Journal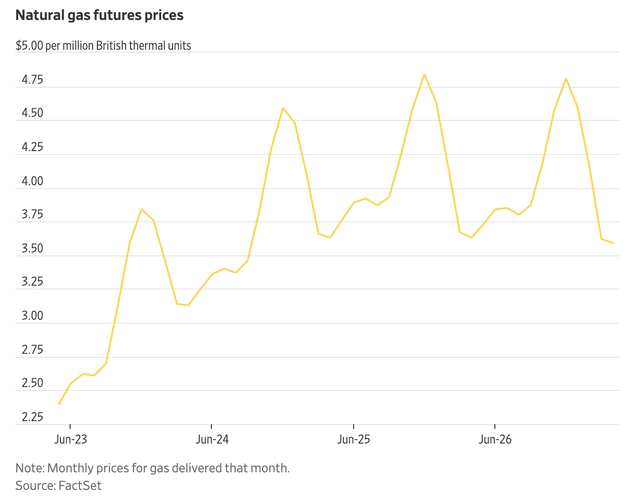
This upward trend in natural gas prices contrasts with the situation in the oil market. For example, on May 23 (when the WSJ published its article), the international benchmark Brent crude for June delivery traded at about $77 a barrel, while crude scheduled for delivery one year from now costs nearly $5 less per barrel.
Bank of America analysts used these price differentials to estimate the future free cash flows of companies. They believe that the elevated prices of natural gas futures are justified due to Europe’s increased reliance on the United States for natural gas, given Russia’s diminished role.
Consequently, the analysts suggest that share prices of natural gas producers like Southwestern Energy (SWN), Chesapeake Energy (CHK), EQT (EQT), and Range Resources could increase by 80% to 175% with limited downside risk.
In comparison, the average upside potential for share prices of oil-focused exploration and production companies is estimated to be 28%.
Range Resources supports the bullish thesis by explaining that natural gas demand is set to soar by more than 20 billion cubic feet per day by 2027. Most of it is expected to come from LNG export demand.
Range Resources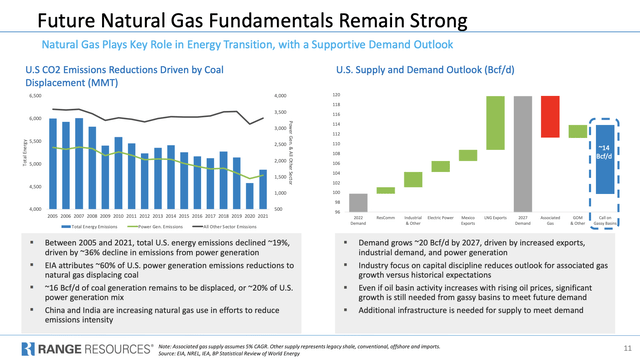
Meanwhile, natural gas supply growth is expected to weaken significantly, which explains why spot prices do not reflect the longer-term bull case.
Range Resources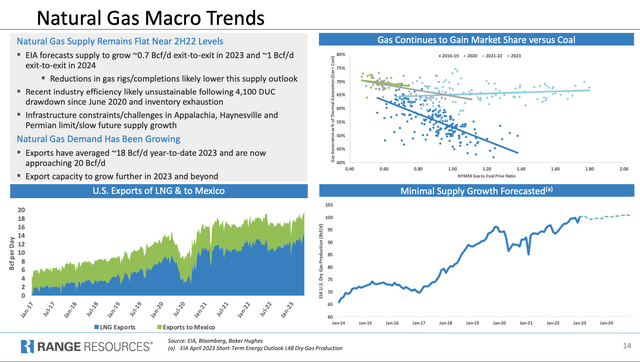
So, what about the valuation?
Valuation
The valuation is a bit tricky, as it requires incorporating a longer-term thesis. In my case, it’s a bullish thesis driven by strong demand growth and subdued supply growth.
While RRC isn’t a high-yielding dividend stock (it yields less than 2%), it has the potential to boost both its dividend and buybacks in the years ahead. The company’s leverage ratio has come down, and its implied free cash flow yield is stunning. At $4.0 Henry Hub, the company could achieve a strong, double-digit free cash flow yield.
Range Resources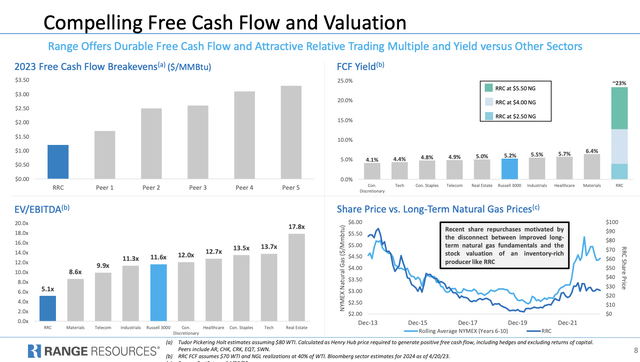
Furthermore, the company’s free cash flow is breakeven at almost $1.00 Henry Hub, which explains why its stock price is holding up so well.
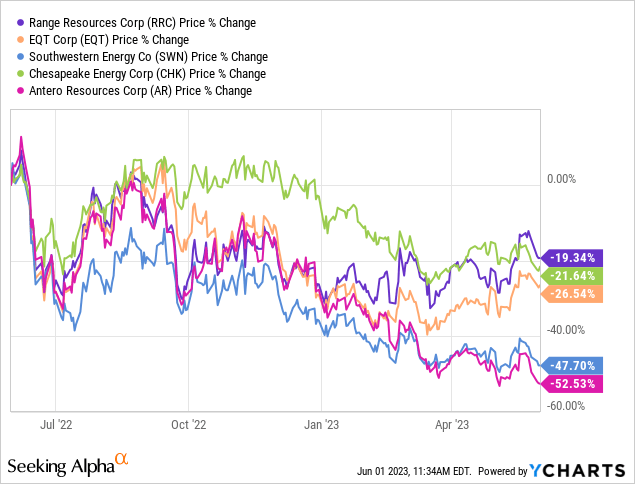
When adding the aforementioned PV-10 values, I believe that Bank of America is right. RRC could easily double the moment higher economic growth supports higher short-term natural gas prices.
I also believe that the weather in Europe is a wild card, as another warm winter is unlikely.
While there’s a high likelihood that Range Resource’s stock will remain stuck in a volatile sideways trend until demand returns, I think RRC will work its way to $60 over the next 2-3 years.
FINVIZ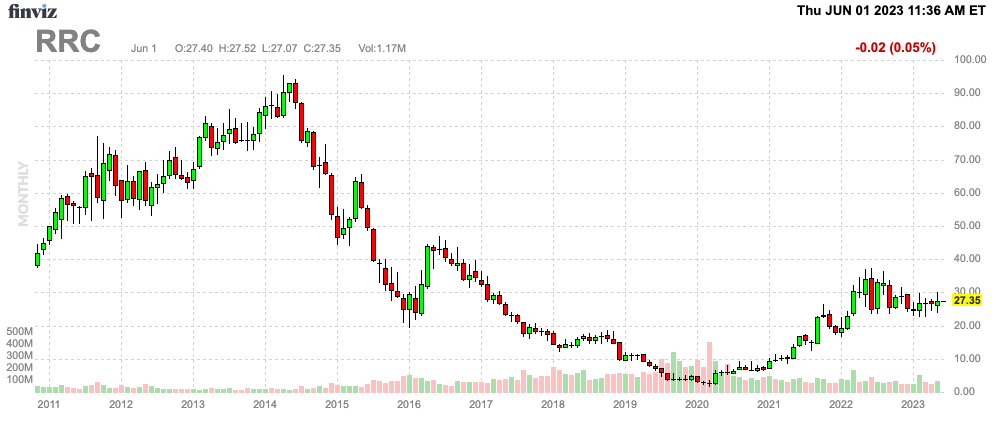
Needless to say, investors interested in natural gas equities need to be aware of cyclical risks and volatility.
Takeaway
Range Resources stands out as a well-run natural gas player with significant potential in the North American market. With deep reserves and efficient operations in the Marcellus Shale, RRC benefits from low breakevens and a strong production outlook.
Its robust inventory allows the company to avoid risky M&A projects, ensuring stability in a market where high-quality reserves are becoming scarce.
RRC’s operational efficiency and extensive breakeven advantage position the company as a leader among its competitors.
The company’s focus on reducing debt, returning capital to shareholders, and employing a thorough hedging strategy demonstrates its commitment to long-term value creation.
Despite current low natural gas prices, RRC’s attractive valuation and positive future outlook make it a promising investment opportunity.
However, investors should be mindful of cyclical risks and volatility, but I expect RRC’s stock to work its way toward $60 over the next few years if my bull case turns out to be correct.
Credit: Source link