
































mohd izzuan/iStock via Getty Images
Market Review and Outlook
During the third quarter, equity markets largely consolidated their strong second-quarter gains amidst broad cross-currents. A noticeable market rotation away from the AI complex toward the broader market left our primary benchmark, the Russell 1000 Growth Index, largely range-bound. Performance across major indices reflected this “tug-of-war” between unyielding corporate earnings and macroeconomic friction. For the quarter, the tech-heavy Nasdaq Composite gained 2.5%, the S&P 500 rose 2.0%, and the value-tilted Dow Jones Industrial Average fell 2.7%. Within large caps, the Russell 1000 Value Index outperformed, advancing 2.3% compared to a modest 0.9% gain for the Russell 1000 Growth Index. Underneath the surface, corporate fundamentals remained resilient: aggregate S&P 500 earnings growth accelerated 400 basis points quarter-over-quarter to roughly 25%, driven primarily by the Technology and Communication Services sectors.
Despite durable top-line fundamental growth, the AI complex experienced sharp volatility in early July, catalyzed by the forced liquidation of the ~$45 billion hedge fund Situational Awareness. The fund’s CIO, Leopold Aschenbrenner, had generated extraordinary trailing returns via heavily leveraged, concentrated positions across the AI ecosystem. When underlying equities experienced a modest pullback, margin pressures triggered an uncoiling of these positions and a cascading liquidation of the fund’s public equity holdings. This unwind reverberated across the broader semiconductor and software trade, starkly illustrating both the concentration risk and the mechanical interconnectedness between leveraged AI exposure and overall index liquidity. Compounding sector-specific volatility was an increasingly complex macro environment. Escalating tensions and erratic negotiations between the U.S. and Iran regarding transit through the Strait of Hormuz drove severe energy price swings. Crude oil troughed near $68/bbl in early July before surging to a year-to-date high near $105/bbl in mid-September. This spike directly bled into headline inflation, lifting September CPI by 30 basis points month-over-month to 3.7%. At the same time, persistent sovereign debt issuance, highlighted by an FY26 federal deficit approaching $2 trillion, led fixed-income investors to demand higher term premiums. The 10-year Treasury yield climbed rapidly from ~4.4% in July to 5.25%, marking its highest level in over two decades. In response to runaway bond yields and renewed price pressures, the Federal Reserve abruptly halted the easing cycle it initiated in September 2024. In mid-September, the FOMC raised the Federal Funds rate by 25 basis points to a target range of 3.75%–4.00%, signaling a re-commitment to stamping out sticky inflation.
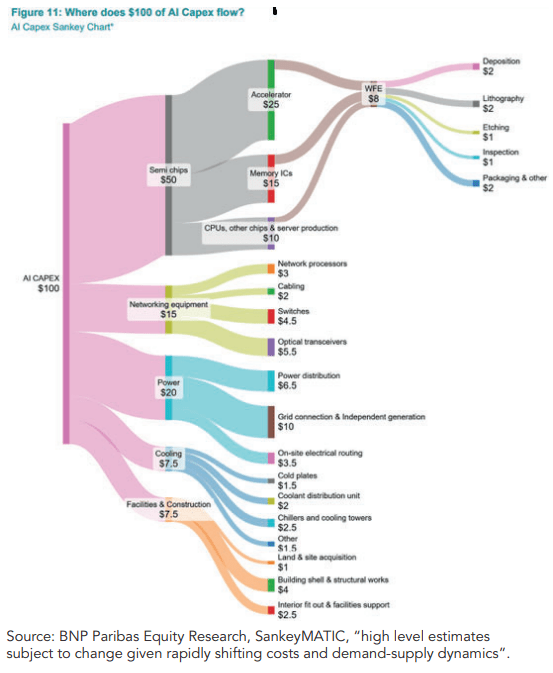
Looking ahead to year-end and into 2027, the three most important forces applying pressure to equity markets are: the durability of hyperscaler capex, a structurally higher cost of capital, and the post-midterm legislative landscape. Within technology, the generative AI narrative is shifting from buildout capacity to return on investment. Scrutiny is mounting as hyperscaler capital expenditures surge while cash flow thins, as three of the top five infrastructure spenders have tipped into negative free cash flow, with the remaining two operating on narrow margins. Because this spending finances the entire AI ecosystem (see chart above), any capex rationalization would carry swift implications for broad tech leadership and valuations. Macroeconomically, the pivot back to monetary tightening and a 10-year Treasury yield above 5% fundamentally alters the market framework. A higher risk-free rate expands discount rates across long-duration growth assets, constraining valuation multiples. In this higher-hurdle regime, resilient balance sheets, real pricing power, and organic cash flow generation will dictate performance over speculative momentum. Politically, the approaching 2026 midterms present a potential stabilizing catalyst. With consensus pointing toward Democrats taking control of both chambers of Congress, markets will likely welcome the return of a divided government. Gridlock creates legislative friction against the administration’s broader agenda, diminishing tail-risk policy outcomes and offering corporate planners a more predictable operating backdrop. Amidst this evolving macro, micro, and political backdrop, our investment discipline remains steadfast. We continue to focus on long-term wealth creation by maintaining concentrated positions in businesses with a high probability of compounding economic value. Our core criteria remain unchanged: we seek to own companies led by prudent management teams, supported by durable secular tailwinds, and built upon advantaged business models with superior unit economics in large expanding markets.
3Q26 Performance
1 ITD = inception-to-date, annualized. Inception date is 1/1/2009.
In a relatively flat market, Ithaka’s portfolio bested the R1000G, beating the index by 570bps (6.7% to 1.0%, gross of fees). Stock selection contributed 580bps to relative performance, with a 10bp negative impact from sector allocation. The portfolio demonstrated relatively strong breadth and depth with 17 of the 30 stocks held for the entire quarter, representing 56% of the names and 65% of the total weighting, outperforming the benchmark.
At the sector level, Ithaka generated positive relative returns in four of the six sectors where we maintain active exposure: Technology (410bps), Consumer Discretionary (130bps), Financial Services (70bps) and Producer Durables (10bps). Outperformance in Technology was due to appreciation in our cybersecurity, traditional SaaS, and Mag 7 names. This strength was attributed to cracks in the narrative that AI was set to replace all software, with the market warming up to the idea that leading software companies could actually be beneficiaries of an AI enabled world. Consumer Discretionary was our second best performing sector, with two of our e-commerce companies driving all of the strength following stellar earnings releases in the quarter. Financial Services saw broad-based participation in the quarter, with all three of our names outperforming the benchmark by a healthy margin. Our outperformance in Producer Durables was entirely driven by sector allocation, with our 300bp underweight to the sector offsetting weak stock selection. Our largest pool of underperformance was in the Materials & Processing Sector, where our sole holding saw multiple contraction following a robust run up in the beginning part of the year. Ithaka’s second source of underperformance was in Health Care, where one of our two holdings underperformed the index by a slight margin. On the allocation side, our 10bps of underperformance was due to our relative overweight to Consumer Discretionary and Materials and our relative underweight in Technology and Energy.
Contributors and Detractors
Top Contributors
CrowdStrike
CrowdStrike is a global leader in cloud-native cybersecurity, delivering its comprehensive Falcon platform, which spans endpoint protection, cloud security, identity threat detection, and next-gen Security Information and Event Management (SIEM), to tens of thousands of enterprise organizations worldwide. The company generates revenue primarily through tiered, module-based software subscriptions, offering flexible consumption models like Falcon Flex, while increasingly diversifying its revenues through professional incident response services, managed security operations, and AI-driven threat intelligence. Its competitive moat is anchored by its single lightweight-agent architecture, the proprietary AI-powered Threat Graph that correlates trillions of security events daily to automate real-time protection, and an expanding global partner ecosystem, leading to high switching costs and robust platform loyalty. CrowdStrike’s resilient performance in the quarter was due to 1) a very formidable earnings announcement that beat Street estimates across the board and 2) a further intensifying narrative that cybersecurity is growing in importance as AI continues to proliferate global workloads.
Microsoft
Microsoft builds best-in-class platforms and provides services that help drive small business productivity, large business competitiveness, and public-sector efficiency. Microsoft’s products include operating systems, cross-device productivity applications, server applications, software development tools, video games, and business-solution applications. The company also designs, manufactures, and sells devices, including PCs, tablets, and gaming/entertainment consoles that all integrate with Azure, its cloud computing service. Microsoft’s stock gapped up ~16% on its earnings announcement that showed accelerating Azure and Microsoft 365 revenue growth. Additionally, management reiterated the company would stay Free Cash Flow positive in FY27, a relief to investors concerned with superfluous spending on AI infrastructure.
ServiceNow
Founded in 2004, ServiceNow has become the leading provider of cloud-based software solutions that define, structure, manage and automate workflow services for global enterprises. ServiceNow pioneered the use of the cloud to deliver IT service management (ITSM) applications. These applications allow users to manage incidents and to plan new IT projects, provision clouds, manage application performance and build applications themselves. The company has since expanded beyond the ITSM market to provide workflow solutions for IT operations management, customer support, human resources, security operations and other enterprise departments where previously a patchwork of semi-automated processes have typically been used with varying degrees of success. ServiceNow’s stock rebounded in the quarter on the fraying narrative that software was going to be completely disintermediated by LLMs. The sector saw a number of integration/collaboration deals struck between legacy software (ServiceNow, Salesforce, Snowflake, etc.) and the model providers (OpenAI and Anthropic).
Top Detractors
Credo
Credo is a fabless semiconductor company enabling the high-speed connectivity that underpins modern AI and cloud data centers. As GPUs in large-scale AI clusters demand exponentially greater bandwidth and lower latency for inter-GPU communication, traditional passive copper cables fail to reach required distances, while optical links, though fast, remain costly, power-hungry, and less reliable. Credo pioneered Active Electrical Cables (AECs), embedding its low-power digital signal processor technology inside copper cables to deliver superior signal integrity over longer distances, at a fraction of the cost, power, and failure rates as optical solutions. Credo’s weakness in the quarter concentrated around its earnings announcement, where management failed to revise the 2026 revenue target for their optical business and guided to higher R&D spending, which overshadowed the all around beat and raise quarter.
Lam Research
Lam Research is the dominant supplier of the etch and deposition tools that physically build modern semiconductor chips. As Moore’s Law shifted from 2D shrinking (ASML’s lithography) to 3D building, FinFET→GAA transistors, 200→300+ layer NAND, stacked HBM, value capture migrated from “drawing” the chip’s pattern to “constructing” the structure, which is Lam’s domain. The company reports revenues in two segments; Systems and Customer Support. Lam’s Systems segment manufactures leading-edge deposition and etch equipment used to fabricate advanced integrated circuits, while the Customer Support segment engineers highly reliable upgrades, spares, and technical services to optimize its global installed base of over 100K chambers. The stock’s pull-back came in the first two days of the third quarter, where a combination of sector-wide profit taking, valuation compression, and emerging doubts pertaining to AI-related memory equipment spending punished the stock. Despite these worries, Lam delivered a pristine earnings announcement with an all around beat and raise, helping recover some of the early quarter retrenchment.
Vertiv
Vertiv is a leading provider of critical digital infrastructure for data centers and communication networks, with a focus on power and thermal management, two of the core bottlenecks of the modern compute infrastructure. Vertiv’s competitive moat is built on two primary pillars: high switching costs and technological specialization. Adding to this moat is Vertiv’s large global field service organization, one of the largest in the industry, offering customers 24/7 maintenance support of this critical infrastructure. The stock sold off following the second quarter’s rare top-line miss against elevated expectations, commentary surrounding project delays, and broader valuation pressure across the AI infrastructure complex.
Transactions
During the quarter we initiated two new positions, Micron (MU) and Sandisk (SNDK), and eliminated one position, Oracle (ORCL). Our trailing 12-month turnover decreased to 28.5% while our trailing 3-year average annual turnover increased slightly to 20.9%.1
Company Profile
In the aftermath of the 2008 financial crisis, two Stanford mathematics and physics graduates, Vladimir Tenev and Baiju Bhatt, moved to New York to build automated algorithmic trading platforms for hedge funds and tier-one banks. Witnessing firsthand the immense technological gulf between elite institutional desks and ordinary retail market participants, they abandoned those ambitions and returned to Silicon Valley in 2013 with a disruptive vision: eliminate trading commissions and build a mobile-first brokerage. This thesis culminated in the founding of Robinhood, a company led by its north star of democratizing finance for all.
1 Turnover Rate indicates the frequency of changes to the portfolio, and is calculated as the greater of the buys or the sells during the period as a percentage of the assets under management at the time of each transaction. The calculation eliminates the effect of client-directed cash flows. Average Annual Turnover is calculated based on a trailing three year period.
Robinhood (HOOD) burst into mainstream consciousness in 2021, when what has now been dubbed the “retail army” was sitting at home flush with cash with nothing to spend it on decided to convene around stock market participation. The company captured and monetized this cultural inflection point against an ideal macroeconomic backdrop of zero-bound interest rates and historic risk appetite. This catalyst sparked explosive customer acquisition, with funded accounts roughly doubling from ~12 million in 2020 to ~23 million in 2021. Yet beyond these cyclical windfalls lie powerful, long-term secular tailwinds: the structural digitization of retail wealth, an unprecedented generational wealth transfer to digital-native Millennial and Gen Z investors (with upwards of $40 trillion set to be inherited over the next two decades), and sustained demand for frictionless multi-asset trading.
With these generational tailwinds at its back, Robinhood executes against its asset flywheel through a highly scalable, software-defined operating model. Unencumbered by legacy branch networks or advisor compensation structures, Robinhood acquires and retains users digitally via intuitive product design and viral distribution loops. This structural cost advantage unlocks substantial operating leverage, allowing the business to expand monetization well beyond payment for order flow (PFOF). Revenue is now broadly diversified across high-margin net interest income on margin balances and cash sweeps, securities lending, transaction fees, and the rapidly compounding Robinhood Gold subscription tier, which now counts ~20% of its 28 million accounts as subscribers. As users mature and build wealth, Robinhood captures incremental wallet share through high-yield cash accounts, retirement match incentives, credit cards, and institutional-grade active trader desktop tools (Robinhood Legend). This product velocity has stabilized fundamental performance, with 13 distinct products now surpassing $100 million in annualized revenues. Even with this expansion, Robinhood’s ~$380 billion in custodied assets represents just ~1% of the relevant competitive universe, underscoring a massive runway for durable compounding.
Underpinning this compounding engine is an executive leadership team that has proven adept at navigating volatile market regimes. Led by co-founder and CEO Vlad Tenev, management has used past down-cycles to methodically re-architect the cost structure—disciplining overhead, reallocating capital toward high-ROI initiatives, and diversifying away from transactional volatility. Ithaka believes Robinhood’s seasoned leadership will continue to scale its product ecosystem profitably, capturing an expanding share of the $40 trillion retail wealth opportunity.
Original Post
Editor’s Note: The summary bullets for this article were chosen by Seeking Alpha editors.
Credit: Source link