
Getty Images
Commentary
Global equity markets rallied sharply in the second quarter, supported by easing geopolitical risk, renewed enthusiasm for AI-linked growth, and strong corporate earnings. Following six weeks of active military conflict in Q1, the US and Iran reached a ceasefire agreement in April, reducing a key source of market uncertainty. Shipping traffic through the Strait of Hormuz resumed, and oil prices declined meaningfully from their Q1 peak.
The reduction in geopolitical risk, combined with continued acceleration in AI infrastructure spending, helped drive broad gains across global equity markets. Leadership was initially concentrated in large-cap growth stocks and US hyperscalers before broadening into small caps and cyclical as the quarter progressed. Semiconductor companies, particularly memory-related businesses, were notable standouts, benefiting from capacity constraints, stronger pricing power, and continued demand tied to AI infrastructure buildouts.
Later in the quarter, the macro backdrop became more complicated. Central banks maintained a generally hawkish posture, and political realignments in key European countries introduced new sources of uncertainty. In the US, the Federal Reserve held rates steady through quarter-end, while market expectations began to shift toward a higher-for-longer rate environment. Separately, the Trump administration’s 10% global tariff is scheduled to expire in late July, with the administration signaling that additional tariffs may follow. As a result, trade policy is likely to remain an important source of uncertainty in the quarters ahead.
In combination, these developments drove a sharp reflation of risk assets even as equity valuations became increasingly stretched and monetary policy appeared less accommodative. In our view, this backdrop raises the importance of durable earnings growth as a differentiator between resilient and vulnerable equities heading into the second half of the year.
US equities led global markets in Q2, reversing the international leadership seen in Q1. The S&P 500 and Nasdaq Composite rose 15% and 21%, respectively, compared with a 14% gain for the MSCI ACWI ex-US Index and a 10% gain for the MSCI ACWI ex-US Small Cap Index. Growth stocks led during the quarter, with the MSCI ACWI ex-US Growth Index’s 17% gain outpacing the MSCI ACWI ex-US Value Index’s 12% gain. Enthusiasm for AI beneficiaries remained a key driver, reflected in the Philadelphia Semiconductor Index’s 88% quarterly surge.
Market leadership began to rotate in June, however, as investors took profits in growth positions and moved into more cyclical and value-oriented sectors that may benefit from economic resilience and a higher-for-longer rate environment. We believe the initial growth- and AI-led rally reflected the unwinding of the geopolitical risk premium built up in Q1, alongside continued strength in AI infrastructure spending. The late-quarter rotation toward small caps and value, in our view, reflected growing conviction in a broader and more durable global economic expansion.
Portfolio Performance & Attribution
The International Equity Strategy outperformed the MSCI ACWI ex-US Index in the 2nd quarter of 2026 returning 21.59% gross and 21.35% net of fees, respectively, versus 14.49% for the benchmark. For the first half of the year, the strategy outperformed the benchmark returning 18.34% gross and 17.89% net of fees, respectively, versus 13.68% for the benchmark.
Stock selection and sector allocation were both strong contributors, adding 367 basis points and 517 basis points, respectively. The strategy’s large overweight to Technology drove the majority of the positive allocation effect, contributing 326 basis points to performance. Underweights to Materials, Utilities, and Healthcare added a combined 121 basis points.
Top stock contributors included SK hynix (SKHY), Samsung Electronics (SSNLF), Kioxia Holdings (KXHCF), and Taiwan Semiconductor Manufacturing Company (TSM), adding a combined 1,156 basis points. The largest detractors were Shell plc (SHEL), Toho (THOOF), Equinor ASA (EQNR)and Saab AB (SAABF), detracting a combined 128 basis points. Geographic allocation added 241 basis points, driven by an underweight to China and a lack of exposure to Australia and Brazil.
The strategy’s top contributors continued to benefit from the sustained global AI build-out, which has intensified supply-demand imbalances across the AI value chain. Taiwan Semiconductor Manufacturing Company, the leading global foundry for advanced semiconductors used in AI training and inference, continued to experience demand running well ahead of manufacturing capacity. This has supported strong pricing power, margin expansion, and upward revisions to earnings estimates.
Memory has been another key bottleneck within the AI value chain, as AI applications require substantially greater memory intensity than many prior computing workloads. The strategy is positioned to benefit from this theme through holdings in NAND and DRAM memory manufacturers Samsung Electronics, SK hynix, and Kioxia Holdings. The earnings power of this group has been supported by demand running materially ahead of supply, which is being added only gradually. This has allowed the group to raise prices aggressively and, in some cases, sell capacity multiple years forward. The strategy continues to hold large positions in these companies, though we tactically took gains throughout the quarter to manage risk.
The strategy’s largest performance detractors were primarily companies affected by the Middle East conflict moving toward resolution, as well as company-specific issues. Shell plc, a global integrated oil company, and Equinor ASA, a Norwegian energy company, both stood to benefit from higher oil prices and supply dislocation at the start of the Iran conflict. Their share prices reflected that early in the quarter. However, as the US and Iran made progress toward reopening the Strait of Hormuz, oil prices normalized, and energy company share prices moved lower. Shell plc and Equinor remain holdings in the strategy, as our long-term theses were not affected by what we view as a transient dislocation.
Another detractor was Toho, a Japanese movie and television producer with intellectual property rights to iconic Japanese characters such as Godzilla. Toho struggled with a period of subdued earnings as it lapped a year of multiple blockbuster releases and entered a year-long air pocket in major movie releases. We exited the position because the next earnings inflection point was outside our investment time frame, and we identified more attractive opportunities elsewhere.
Saab AB, a Swedish defense company, underperformed after a strong prior run left expectations elevated across European defense stocks. While demand remains supported by higher defense spending, the market focused on near-term execution risks, including component availability, capacity expansion, and working-capital needs. Saab remains a holding in the strategy, as our long-term thesis was not affected by what we view as near-term volatility following a period of strong performance.
Portfolio Activity
During the quarter, we initiated positions in ASPEED Technology, Ryohin Keikaku (RYKKF), Mitsubishi UFJ Financial Group (MUFG), Tokio Marine Holdings (TKOMF), AstraZeneca (AZN), Nokia (NOK), Rentokil (RTO), RWE AG (RWNFF), and Technoprobe (THNBY). We exited positions in Toho, Aviva (AIVAF), Celestica (CLS), LifeCo (GWLIF), and Rheinmetall (RNMBF).
Outlook
We remain focused on bottom-up stock selection and identifying companies undergoing sustainable positive fundamental inflection, where we believe improving earnings power, returns, or competitive position is not yet fully reflected in market expectations.
Thank you for your continued interest in Polen Capital and the International Equity Portfolio. Please do not hesitate to reach out with any questions.
Experience in Growth Investing
Seeks Growth & Capital Preservation (Performance (%) as of 6-30-2026)
The commentary is not intended as a guarantee of profitable outcomes. Any forward-looking statements are based on certain expectations and assumptions that are susceptible to changes in circumstances. Opinions and views expressed constitute the judgment of Polen Capital as of the date herein, may involve a number of assumptions and estimates which are not guaranteed, and are subject to change. (Source: Archer. Returns are trailing through 06-30-2026. Annualized returns are presented for periods greater than one year. Past performance and does not guarantee future results. Returns are presented gross and net of fees. Net of fee performance was calculated using actual management fees or highest fees for fund structures. Performance shown prior to 05-26-2026 represents results achieved for CastleArk Management (“CastleArk”). The International Small Cap Equity strategy (the “Strategy”) has been managed by Polen Capital since 05-26-2026. CastleArk and Polen Capital have formed a joint venture co-owned by the Strategy’s key personnel. This includes Mr. Ajoy Reddi, who has served as the portfolio manager of the Strategy since inception, Mr. Ken Wang, and Ms. Huong Le. At all times, Mr. Reddi has had ultimate decision-making authority with respect to the Strategy. Mr. Wang joined CastleArk in October 2021 and Ms. Le joined CastleArk in September 2024. Mr. Maneesh Singhal joined the Strategy team on March 1, 2019 and became co-portfolio manager on April 1, 2024. On August 31, 2024, Mr. Singhal left CastleArk and joined Polen Capital. Mr. Singhal rejoined the Strategy team as portfolio manager as part of the joint venture.)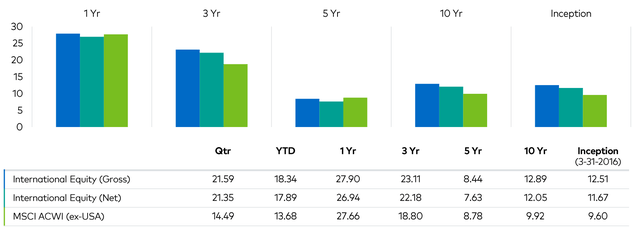
Original Post
Credit: Source link