



Donny DBM/iStock via Getty Images
Dust in the Wind – Song by Kansas (1977)
“I close my eyes,only for a moment, and the moment’s goneAll my dreamspass before my eyes with curiosityDust in the windAll they are is dust in the wind”
Introduction
“All we are is dust in the wind.” Kansas wasn’t thinking about financial markets in 1977, but the line fits 2026 about as well as anything on a Bloomberg terminal. This year we watched fortunes that felt permanent blow away in a matter of days: MicroStrategy (MSTR), a small-cap crypto sub-sector, and twenty years of Chinese real estate gains. The theme of the song, and of this letter, is humility: almost nothing in markets lasts as long as the people riding it believe it will.
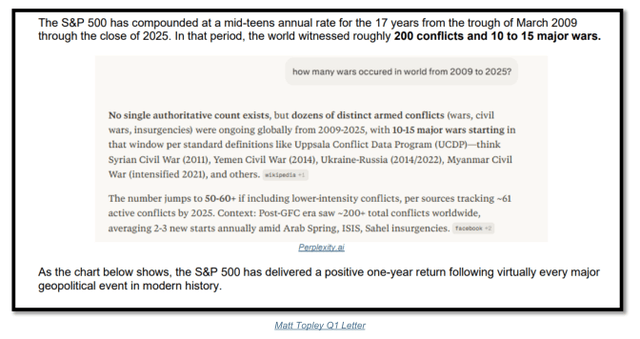
In our Q1 Letter, “All Along the Watchtower, ” we walked through the long history of military conflict and the stock market just as the Iran war began. Here is what we wrote:
“Markets are amoral. Wars tend to produce short-term disruptions that, historically, create buying opportunities. Right now, I rank the Iran war as #3 on the 2026 risk scale, behind the private equity / credit bear market at #2 and the ‘known unknown’ of the AI buildout at #1. We expect volatility to remain elevated through 2026 due to the midterm elections and the new Fed chair appointment.” (Q1 2026 Letter)
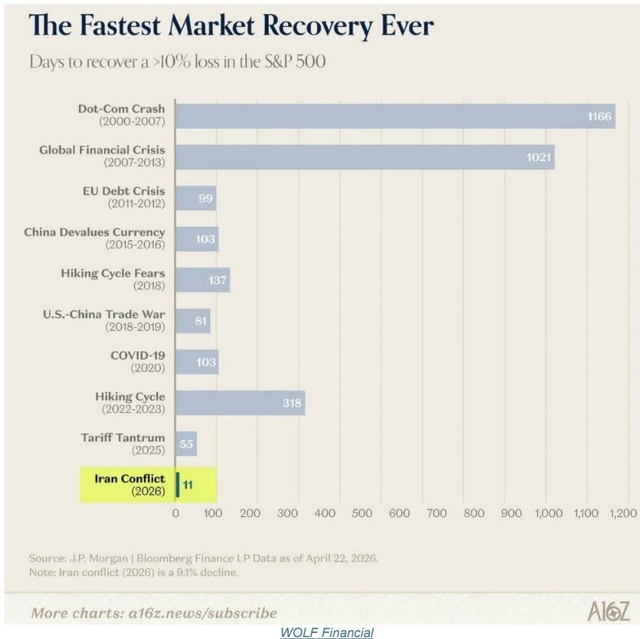
Once again, stocks delivered after the bombs dropped, but I never would have guessed the pace of the rally. How about the fastest V-shaped recovery in history? The S&P 500 sold off -10% at the start of the Iran conflict and made back every point just 11 days later. Dust in the wind.
Part I. The Known Unknown of the AI Buildout
The artificial intelligence buildout has its skeptics, and OpenAI (OPENAI) has more than a few bears. Some analysts don’t believe OpenAI will ever IPO. Others are far more blunt, like Ed Zitron below:
“Look. OpenAI intends to burn over $852 billion by the end of 2030. It accounts for $748 billion of the remaining performance obligations of Microsoft (MSFT), Amazon (AMZN), and Oracle (ORCL), on top of at least another $70 billion of RPOs across Cerebras (CBRS), CoreWeave (CRWV), Nebius (NBIS), IREN (IREN), Lambda, and Nscale, and plans to spend indeterminate billions on Broadcom (AVGO) ‘Jalapeno’ chips. It intends to spend $50 billion or more on compute this year, which I estimate is more than 50% of all global AI compute spend.”
“OpenAI can only afford that thanks to its latest $122 billion funding round, of which it has received at least $50 billion, including $20 billion from SoftBank (SFTBY). NVIDIA (NVDA) noted in its latest quarterly earnings that ‘one AI research and deployment company contributed a meaningful amount of revenue by purchasing cloud services from our customers, ‘ referring, of course, to OpenAI.”
The cash burn is the top-ranked known unknown: revenue may arrive far slower than spending, with infrastructure getting built faster than a profitable business case can form. The chart below, one of the most-shared of 2026, from Bank of America, shows the hyperscalers (AMZN, MSFT, META (META), GOOGL (GOOGL)) spending 80% of their free cash flow on chips and data centers.
Exhibit 6: A generational transfer in free cash flow is taking place
12m forward FCF of “hyperscalers” and semiconductor companies, $bn
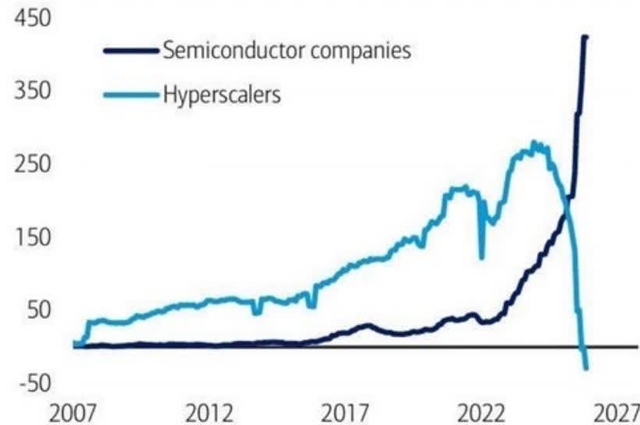 FCF) in billions of dollars for semiconductor companies and hyperscalers from 2007 to 2027. The semiconductor companies’ FCF (dark blue line) shows a steady upward trend, starting near zero in 2007 and reaching approximately 400 billion dollars by 2027. The hyperscalers’ FCF (light blue line) shows a more volatile but generally upward trend, starting around 20 billion in 2007, peaking at about 250 billion in 2022, and then dropping sharply to around -50 billion by 2027.” contenteditable=”false” width=”640″ height=”425″ loading=”lazy” srcset=”https://static.seekingalpha.com/uploads/2026/7/20/542689-17845925031969144_origin.jpg?io=w640 640w,https://static.seekingalpha.com/uploads/2026/7/20/542689-17845925031969144_origin.jpg?io=w480 480w,https://static.seekingalpha.com/uploads/2026/7/20/542689-17845925031969144_origin.jpg?io=w320 320w,https://static.seekingalpha.com/uploads/2026/7/20/542689-17845925031969144_origin.jpg?io=w240 240w” sizes=”(max-width: 767px) calc(100vw – 36px), (max-width: 1023px) calc(100vw – 180px), 552px”>
 BofA GLOBAL RESEARCH
That raises the next known unknown: bottlenecks. AI needs energy, water, chips, data, and people. In other words, our most profitable American companies have chosen to be short-term unprofitable on a bet that could stall out in a logjam.
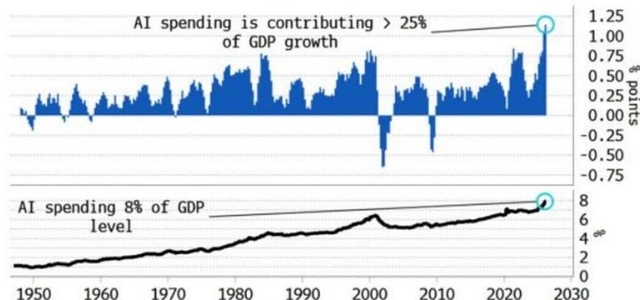
AI spending is now running near 8% of GDP. During the dot-com bubble, tech spending peaked around 6.5%. Read that again. We have already outspent the internet bubble, which means the stock market and the economy are deeply dependent on AI right now.
GDP Is Highly Dependent on AI Spending
■ Contribution to Nominal GDP YoY of AI Investment[Spending on Software + IT Equipment + R&D + Data Centres (per Fed method)]— AI Investment as % of Nominal GDP ((Level Terms))
Bloomberg
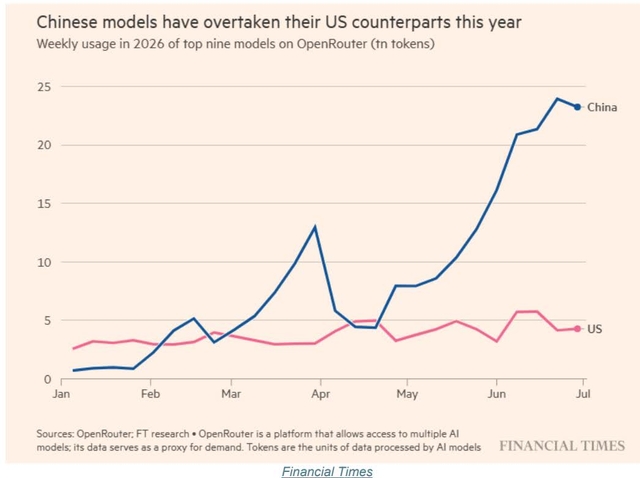
Like a broken record, China is here to copy our work and sell it cheaper. The next chart was a punch in the face this week: in just three months, cheap Chinese models have taken massive market share. “Buy American” won’t hold with technology this transformative. Companies around the world will act in the best interest of their own bottom line. This chart screams “price war.”
New world-changing technologies often see a first move higher that turns into a speculative run-up before the long-term winners and losers are clear. The first move is the knee-jerk reaction to the new technology; the real move comes later, when the strongest survivors prove their profitability. Historically, there is a bubble in between. The first movers that look invincible today are often gone before the real winners arrive. Dust in the wind.
As I’ve noted in previous letters, both midterm election years and the arrival of a new Fed governor have a history of coinciding with stock market corrections. But there is a big difference between the -20% correction that shows up every five years and the bursting of a true bubble.
The small-crypto-coin bubble burst in October 2025, sending that sub-sector down -90% in a single day; the Nasdaq fell -70% during the internet bubble. Those were real bubbles. We will see winners and losers around the AI trade, with some companies facing obsolescence, but let me revisit the internet bubble one more time.
Part II. Good News: However the Known Unknown Falls, It’s Not the Internet Bubble
We keep moving from one mini-bubble to the next without blowing up the broader market. NVDA was the most important stock in the world; now MU has taken the lead. The Mag 7 used to drive the entire market. Now semiconductors are driving returns.
To repeat my stance from the Q4 2025 letter: this is not the 1999 to 2000 bubble. Speculation is rampant: record margin debt, the explosive growth of leveraged ETFs, same-day options ((rat poison)), prediction markets ((here to stay)), and a parade of sub-sector mini-bubbles.
But the tech sector today carries 2.5x the profit margins of 1999 at half the P/E ratio. Over the last nine months we have lived through a crypto winter, a private equity bear, negative Mag 7 returns, a silver bubble, and an energy-price explosion, and the S&P and Nasdaq are still up strong.
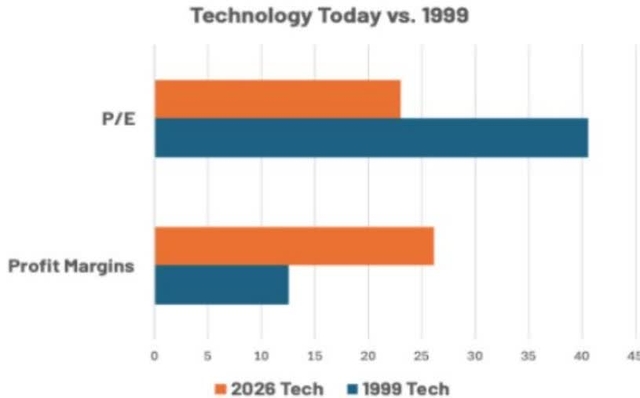
Source: LSEG, IBES, MSCI (MSCI), RiverFront; data weekly, as of 06.11.2026. Chart shown for illustrative purposes only. Past performance is no indication of future results.
Here is Chart Kid Matt (not me) showing that the forward price-to-earnings ratio of the S&P has actually fallen in 2026, versus climbing 300% in 1999. The U.S. market is expensive and dotted with sub-sector bubbles, but it is not a copy of the internet bubble.
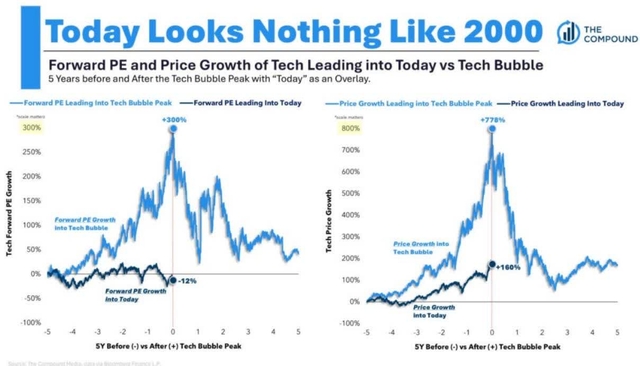
Source: The Compound Media, data via Bloomberg Finance L.P.
Here’s a compact side-by-side on the 1999 dot-com period vs. 2026 for the S&P 500 and the broader market backdrop.
Remember when analysts warned the market was too concentrated in the Mag 7? The entire mega-cap premium has now been erased (see below). On a one-year basis, semiconductors have returned 4x the Mag 7, so much so that the semiconductor index is now record-expensive while Mag 7 valuations look cheaper. Just remember: every technology stock eventually faces the big O, obsolescence. Today’s must-own name can be tomorrow’s afterthought. Dust in the wind. As I write, the semiconductor index corrected -20% from highs.
Mag 7 P/E premium at the lowest level in more than a decade
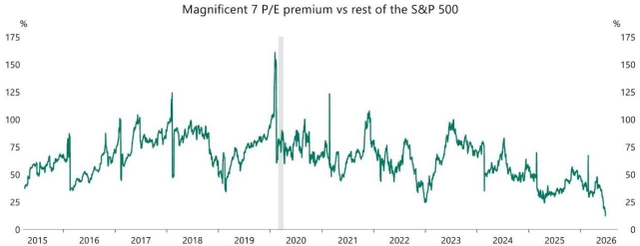
Torsten Slok Apollo (APO)
Part III. Is Diversification Back?
For 15 years, with little interruption, large-cap growth stocks outran the diversified portfolio, leaving nearly every other asset class looking cheap relative to the S&P 500. Over the last 12 months and year to date, it has been revenge for the diversified portfolio.
Emerging markets and small-cap stocks have returned 5x U.S. large-cap growth. Just when everyone had given up on diversification, it worked. Bonds are in the worst bear market in history; in the next true market meltdown, I would expect them to do their job again.
In markets, leadership is borrowed, never owned. Kansas had it right: almost nothing lasts but the earth and the sky.
Diversification Matters: 2026 Year-to-Date Total Returns(Data via YCharts as of 6/30/26)
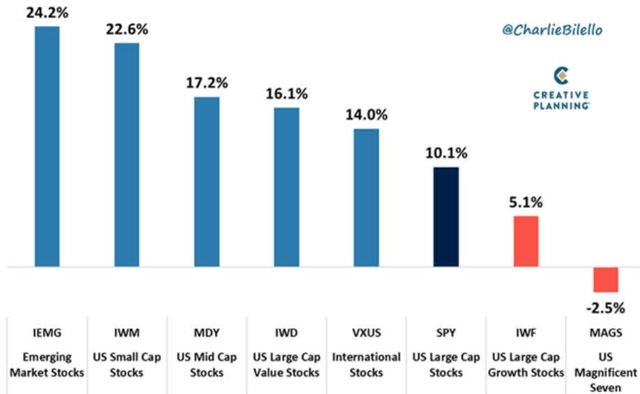
@CharlieBilello CREATIVE PLANNING
Part IV. Communism Still Sucks
Here is the good news about China rolling out cheap AI models: communism still sucks.
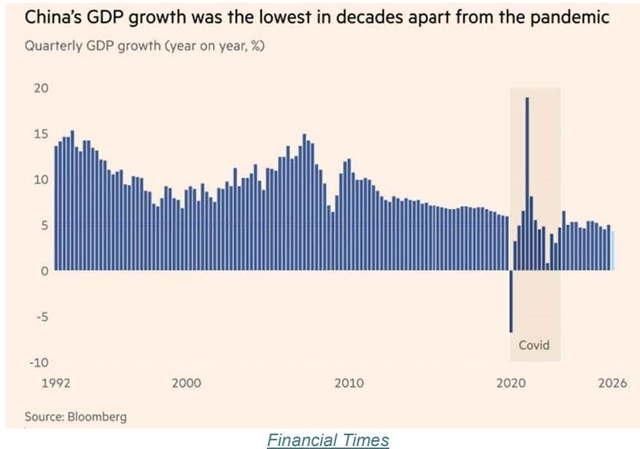
Can you imagine 20 years of American residential real estate gains being wiped out? That is -50% on every home in America. My handicap on that happening here is 1%, but in a top-down economy like China’s, they just lived it. Two decades of gains, gone. Dust in the wind.
China’s Real Estate Market has erased all gains from the last 20 years
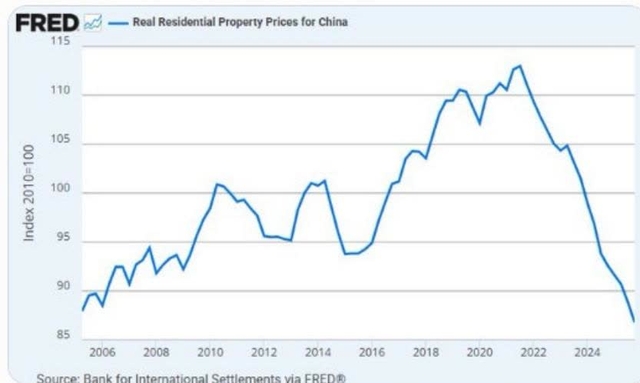
Source: Bank for International Settlements via FRED®
China is dealing with weak private investment and consumer spending, slumping property values, enormous youth unemployment, and a long-term demographic shrinkage of its population. On a one-year basis, emerging market ETFs are beating Chinese market ETFs by close to 40%.
Side Note: A One-Year Follow-Up on “TBD”
“The man with the briefcase can steal more money than the man with the gun.” -Vito Corleone
This is not investment advice. I am not a crypto expert, and this could just be another Bitcoin winter.
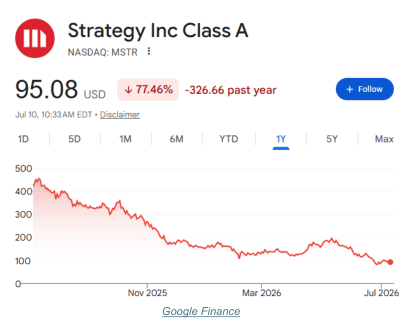
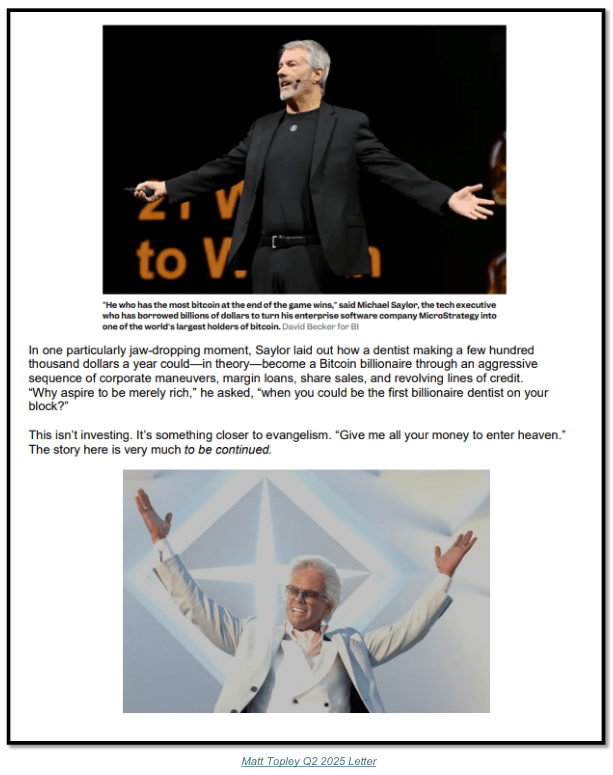
But it is the one-year anniversary of our Q2 2025 letter, “The Times They Are a-Changin’.” In it, we referenced Michael Saylor’s speech on how a dentist could become a Bitcoin millionaire. Since that day, MSTR is down – 77%. Dust in the wind.
The “first billionaire dentist” built on buying MSTR is not going to happen. Saylor has started selling Bitcoin, a transaction he swore he would never make.
Conclusion
Wall Street is an amazing wealth generator. The American economy is so dynamic that it still astonishes me after 30 years in the business. But public markets, like life, are also about storytelling, and some of those tales are spun by the unscrupulous cousins of Wall Street who are coming for your family’s wealth.
As we have covered in previous letters, today’s market carries a high level of speculation and outright gambling. That is what is creating these rolling mini-bubbles that burst without taking down the broader indexes. It will keep punishing the risk-takers, but America will innovate and grow.
There is a Wolf of Wall Street documentary on Paramount Plus right now, this was true boiler house theft at the highest level, but I am not sure we don’t have more sophisticated legal financial grift happening today. Let’s be careful out there.
The AI buildout is the biggest American known unknown in 25 years, and history says these moments create bubbles before the true winners reveal themselves on the other side of the volatility. That unpredictability is exactly why we diversify and stay composed. Investing is a psychology game, not an IQ game.
Which brings us back to Kansas. The comfort in “dust in the wind” isn’t fatalism. It’s perspective. The mini-bubbles will keep forming and bursting, the known unknowns will keep us guessing, and the storytellers will keep spinning their tales. What endures, the earth and sky, in the song’s words, is a diversified portfolio, a long time horizon, and the discipline to stay composed while everyone else chases the next gust of wind.
Dust in the Wind – Song by Kansas (1977)
“Now don’t hang onNothin’ lasts forever but the earth and skyIt slips awayAnd all your money won’t another minute buyDust in the windAll we are is dust in the wind(All we are is dust in the wind)Dust in the wind(Everything is dust in the wind)Everything is dust in the wind(In the wind)”
References
- 1. Source: Wikipedia
- 2. Source: Facebook
- 1. Source: Millcreek
- 1. Source: Finance. Yahoo
- 1. Source: Investor. Newslens
- 2. Source: Finance. Yahoo
Original Post
Editor’s Note: The summary bullets for this article were chosen by Seeking Alpha editors.
Credit: Source link