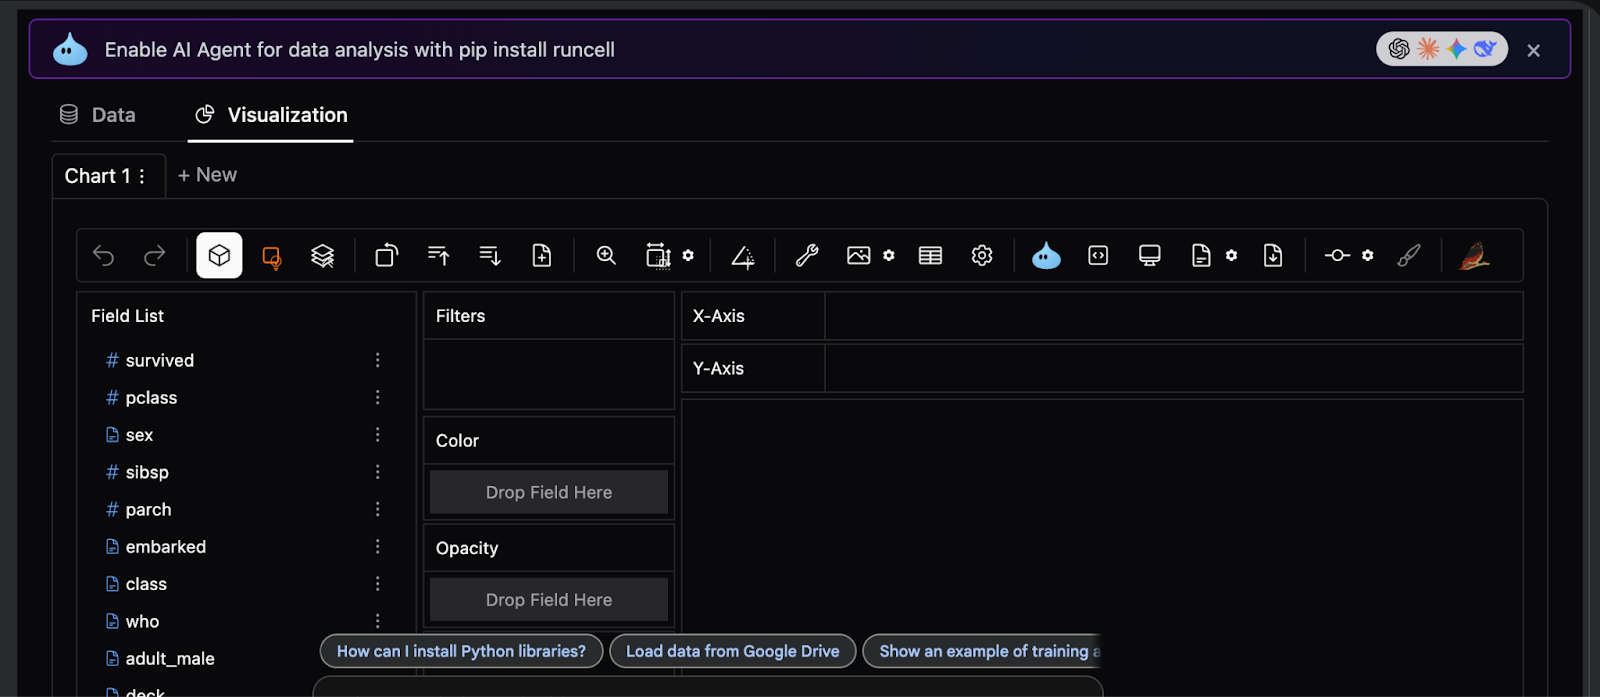

In this tutorial, we demonstrate how to move beyond static, code-heavy charts and build a genuinely interactive exploratory data analysis workflow directly using PyGWalker. We start by preparing the Titanic dataset for large-scale interactive querying. These analysis-ready engineered features reveal the underlying structure of the data while enabling both detailed row-level exploration and high-level aggregated views for deeper insight. Embedding a Tableau-style drag-and-drop interface directly in the notebook enables rapid hypothesis testing, intuitive cohort comparisons, and efficient data-quality inspection, all without the friction of switching between code and visualization tools.
import sys, subprocess, json, math, os
from pathlib import Path


def pip_install(pkgs):
   subprocess.check_call([sys.executable, "-m", "pip", "install", "-q"] + pkgs)


pip_install([
   "pygwalker>=0.4.9",
   "duckdb>=0.10.0",
   "pandas>=2.0.0",
   "numpy>=1.24.0",
   "seaborn>=0.13.0"
])


import numpy as np
import pandas as pd
import seaborn as sns


df_raw = sns.load_dataset("titanic").copy()
print("Raw shape:", df_raw.shape)
display(df_raw.head(3))
We set up a clean and reproducible Colab environment by installing all required dependencies for interactive EDA. We load the Titanic dataset and perform an initial sanity check to understand its raw structure and scale. It establishes a stable foundation before any transformation or visualization begins.
def make_safe_bucket(series, bins=None, labels=None, q=None, prefix="bucket"):
   s = pd.to_numeric(series, errors="coerce")
   if q is not None:
       try:
           cuts = pd.qcut(s, q=q, duplicates="drop")
           return cuts.astype("string").fillna("Unknown")
       except Exception:
           pass
   if bins is not None:
       cuts = pd.cut(s, bins=bins, labels=labels, include_lowest=True)
       return cuts.astype("string").fillna("Unknown")
   return s.astype("float64")


def preprocess_titanic_advanced(df):
   out = df.copy()
   out.columns = [c.strip().lower().replace(" ", "_") for c in out.columns]


   for c in ["survived", "pclass", "sibsp", "parch"]:
       if c in out.columns:
           out[c] = pd.to_numeric(out[c], errors="coerce").fillna(-1).astype("int64")


   if "age" in out.columns:
       out["age"] = pd.to_numeric(out["age"], errors="coerce").astype("float64")
       out["age_is_missing"] = out["age"].isna()
       out["age_bucket"] = make_safe_bucket(
           out["age"],
           bins=[0, 12, 18, 30, 45, 60, 120],
           labels=["child", "teen", "young_adult", "adult", "mid_age", "senior"],
       )


   if "fare" in out.columns:
       out["fare"] = pd.to_numeric(out["fare"], errors="coerce").astype("float64")
       out["fare_is_missing"] = out["fare"].isna()
       out["log_fare"] = np.log1p(out["fare"].fillna(0))
       out["fare_bucket"] = make_safe_bucket(out["fare"], q=8)


   for c in ["sex", "class", "who", "embarked", "alone", "adult_male"]:
       if c in out.columns:
           out[c] = out[c].astype("string").fillna("Unknown")


   if "cabin" in out.columns:
       out["deck"] = out["cabin"].astype("string").str.strip().str[0].fillna("Unknown")
       out["deck_is_missing"] = out["cabin"].isna()
   else:
       out["deck"] = "Unknown"
       out["deck_is_missing"] = True


   if "ticket" in out.columns:
       t = out["ticket"].astype("string")
       out["ticket_len"] = t.str.len().fillna(0).astype("int64")
       out["ticket_has_alpha"] = t.str.contains(r"[A-Za-z]", regex=True, na=False)
       out["ticket_prefix"] = t.str.extract(r"^([A-Za-z\.\/\s]+)", expand=False).fillna("None").str.strip()
       out["ticket_prefix"] = out["ticket_prefix"].replace("", "None").astype("string")


   if "sibsp" in out.columns and "parch" in out.columns:
       out["family_size"] = (out["sibsp"] + out["parch"] + 1).astype("int64")
       out["is_alone"] = (out["family_size"] == 1)


   if "name" in out.columns:
       title = out["name"].astype("string").str.extract(r",\s*([^\.]+)\.", expand=False).fillna("Unknown").str.strip()
       vc = title.value_counts(dropna=False)
       keep = set(vc[vc >= 15].index.tolist())
       out["title"] = title.where(title.isin(keep), other="Rare").astype("string")
   else:
       out["title"] = "Unknown"


   out["segment"] = (
       out["sex"].fillna("Unknown").astype("string")
       + " | "
       + out["class"].fillna("Unknown").astype("string")
       + " | "
       + out["age_bucket"].fillna("Unknown").astype("string")
   )


   for c in out.columns:
       if out[c].dtype == bool:
           out[c] = out[c].astype("int64")
       if out[c].dtype == "object":
           out[c] = out[c].astype("string")


   return out


df = preprocess_titanic_advanced(df_raw)
print("Prepped shape:", df.shape)
display(df.head(3))
We focus on advanced preprocessing and feature engineering to convert the raw data into an analysis-ready form. We create robust, DuckDB-safe features such as buckets, segments, and engineered categorical signals that enhance downstream exploration. We ensure the dataset is stable, expressive, and suitable for interactive querying.
def data_quality_report(df):
   rows = []
   n = len(df)
   for c in df.columns:
       s = df[c]
       miss = int(s.isna().sum())
       miss_pct = (miss / n * 100.0) if n else 0.0
       nunique = int(s.nunique(dropna=True))
       dtype = str(s.dtype)
       sample = s.dropna().head(3).tolist()
       rows.append({
           "col": c,
           "dtype": dtype,
           "missing": miss,
           "missing_%": round(miss_pct, 2),
           "nunique": nunique,
           "sample_values": sample
       })
   return pd.DataFrame(rows).sort_values(["missing", "nunique"], ascending=[False, False])


dq = data_quality_report(df)
display(dq.head(20))


RANDOM_SEED = 42
MAX_ROWS_FOR_UI = 200_000


df_for_ui = df
if len(df_for_ui) > MAX_ROWS_FOR_UI:
   df_for_ui = df_for_ui.sample(MAX_ROWS_FOR_UI, random_state=RANDOM_SEED).reset_index(drop=True)


agg = (
   df.groupby(["segment", "deck", "embarked"], dropna=False)
     .agg(
         n=("survived", "size"),
         survival_rate=("survived", "mean"),
         avg_fare=("fare", "mean"),
         avg_age=("age", "mean"),
     )
     .reset_index()
)


for c in ["survival_rate", "avg_fare", "avg_age"]:
   agg[c] = agg[c].astype("float64")


Path("/content").mkdir(parents=True, exist_ok=True)
df_for_ui.to_csv("/content/titanic_prepped_for_ui.csv", index=False)
agg.to_csv("/content/titanic_agg_segment_deck_embarked.csv", index=False)
We evaluate data quality and generate a structured overview of missingness, cardinality, and data types. We prepare both a row-level dataset and an aggregated cohort-level table to support fast comparative analysis. The dual representation allows us to explore detailed patterns and high-level trends simultaneously.
import pygwalker as pyg


SPEC_PATH = Path("/content/pygwalker_spec_titanic.json")


def load_spec(path):
   if path.exists():
       try:
           return json.loads(path.read_text())
       except Exception:
           return None
   return None


def save_spec(path, spec_obj):
   try:
       if isinstance(spec_obj, str):
           spec_obj = json.loads(spec_obj)
       path.write_text(json.dumps(spec_obj, indent=2))
       return True
   except Exception:
       return False


def launch_pygwalker(df, spec_path):
   spec = load_spec(spec_path)
   kwargs = {}
   if spec is not None:
       kwargs["spec"] = spec


   try:
       walker = pyg.walk(df, use_kernel_calc=True, **kwargs)
   except TypeError:
       walker = pyg.walk(df, **kwargs) if spec is not None else pyg.walk(df)


   captured = None
   for attr in ["spec", "_spec"]:
       if hasattr(walker, attr):
           try:
               captured = getattr(walker, attr)
               break
           except Exception:
               pass
   for meth in ["to_spec", "export_spec", "get_spec"]:
       if captured is None and hasattr(walker, meth):
           try:
               captured = getattr(walker, meth)()
               break
           except Exception:
               pass


   if captured is not None:
       save_spec(spec_path, captured)


   return walker


walker_rows = launch_pygwalker(df_for_ui, SPEC_PATH)
walker_agg = pyg.walk(agg)
We integrate PyGWalker to transform our prepared tables into a fully interactive, drag-and-drop analytical interface. We persist the visualization specification so that dashboard layouts and encodings survive notebook reruns. It turns the notebook into a reusable, BI-style exploration environment.
HTML_PATH = Path("/content/pygwalker_titanic_dashboard.html")


def export_html_best_effort(df, spec_path, out_path):
   spec = load_spec(spec_path)
   html = None


   try:
       html = pyg.walk(df, spec=spec, return_html=True) if spec is not None else pyg.walk(df, return_html=True)
   except Exception:
       html = None


   if html is None:
       for fn in ["to_html", "export_html"]:
           if hasattr(pyg, fn):
               try:
                   f = getattr(pyg, fn)
                   html = f(df, spec=spec) if spec is not None else f(df)
                   break
               except Exception:
                   continue


   if html is None:
       return None


   if not isinstance(html, str):
       html = str(html)


   out_path.write_text(html, encoding="utf-8")
   return out_path


export_html_best_effort(df_for_ui, SPEC_PATH, HTML_PATH)
We extend the workflow by exporting the interactive dashboard as a standalone HTML artifact. We ensure the analysis can be shared or reviewed without requiring a Python environment or Colab session. It completes the pipeline from raw data to distributable, interactive insight.
In conclusion, we established a robust pattern for advanced EDA that scales far beyond the Titanic dataset while remaining fully notebook-native. We showed how careful preprocessing, type safety, and feature design allow PyGWalker to operate reliably on complex data, and how combining detailed records with aggregated summaries unlocks powerful analytical workflows. Instead of treating visualization as an afterthought, we used it as a first-class interactive layer, allowing us to iterate, validate assumptions, and extract insights in real time.
Check out the Full Codes here. Also, feel free to follow us on Twitter and don’t forget to join our 100k+ ML SubReddit and Subscribe to our Newsletter. Wait! are you on telegram? now you can join us on telegram as well.
The post How to Build an Advanced, Interactive Exploratory Data Analysis Workflow Using PyGWalker and Feature-Engineered Data appeared first on MarkTechPost.
Credit: Source link