In this tutorial, we explore the advanced capabilities of PyGWalker, a powerful tool for visual data analysis that integrates seamlessly with pandas. We begin by generating a realistic e-commerce dataset enriched with time, demographic, and marketing features to mimic real-world business data. We then prepare multiple analytical views, including daily sales, category performance, and customer segment summaries. Finally, we use PyGWalker to interactively explore patterns, correlations, and trends across these dimensions through intuitive drag-and-drop visualizations. Check out the FULL CODES here.
!pip install pygwalker pandas numpy scikit-learn


import pandas as pd
import numpy as np
import pygwalker as pyg
from datetime import datetime, timedelta
We begin by setting up our environment, installing all necessary dependencies, and importing essential libraries, including pandas, numpy, and pygwalker. We ensure that everything is ready for building our interactive data exploration workflow in Colab. Check out the FULL CODES here.
def generate_advanced_dataset():
   np.random.seed(42)
   start_date = datetime(2022, 1, 1)
   dates = [start_date + timedelta(days=x) for x in range(730)]
   categories = ['Electronics', 'Clothing', 'Home & Garden', 'Sports', 'Books']
   products = {
       'Electronics': ['Laptop', 'Smartphone', 'Headphones', 'Tablet', 'Smartwatch'],
       'Clothing': ['T-Shirt', 'Jeans', 'Dress', 'Jacket', 'Sneakers'],
       'Home & Garden': ['Furniture', 'Lamp', 'Rug', 'Plant', 'Cookware'],
       'Sports': ['Yoga Mat', 'Dumbbell', 'Running Shoes', 'Bicycle', 'Tennis Racket'],
       'Books': ['Fiction', 'Non-Fiction', 'Biography', 'Science', 'History']
   }
   n_transactions = 5000
   data = []
   for _ in range(n_transactions):
       date = np.random.choice(dates)
       category = np.random.choice(categories)
       product = np.random.choice(productsAI Shorts)
       base_prices = {
           'Electronics': (200, 1500),
           'Clothing': (20, 150),
           'Home & Garden': (30, 500),
           'Sports': (25, 300),
           'Books': (10, 50)
       }
       price = np.random.uniform(*base_pricesAI Shorts)
       quantity = np.random.choice([1, 1, 1, 2, 2, 3], p=[0.5, 0.2, 0.15, 0.1, 0.03, 0.02])
       customer_segment = np.random.choice(['Premium', 'Standard', 'Budget'], p=[0.2, 0.5, 0.3])
       age_group = np.random.choice(['18-25', '26-35', '36-45', '46-55', '56+'])
       region = np.random.choice(['North', 'South', 'East', 'West', 'Central'])
       month = date.month
       seasonal_factor = 1.0
       if month in [11, 12]:
           seasonal_factor = 1.5
       elif month in [6, 7]:
           seasonal_factor = 1.2
       revenue = price * quantity * seasonal_factor
       discount = np.random.choice([0, 5, 10, 15, 20, 25], p=[0.4, 0.2, 0.15, 0.15, 0.07, 0.03])
       marketing_channel = np.random.choice(['Organic', 'Social Media', 'Email', 'Paid Ads'])
       base_satisfaction = 4.0
       if customer_segment == 'Premium':
           base_satisfaction += 0.5
       if discount > 15:
           base_satisfaction += 0.3
       satisfaction = np.clip(base_satisfaction + np.random.normal(0, 0.5), 1, 5)
       data.append({
           'Date': date, 'Category': category, 'Product': product, 'Price': round(price, 2),
           'Quantity': quantity, 'Revenue': round(revenue, 2), 'Customer_Segment': customer_segment,
           'Age_Group': age_group, 'Region': region, 'Discount_%': discount,
           'Marketing_Channel': marketing_channel, 'Customer_Satisfaction': round(satisfaction, 2),
           'Month': date.strftime('%B'), 'Year': date.year, 'Quarter': f'Q{(date.month-1)//3 + 1}'
       })
   df = pd.DataFrame(data)
   df['Profit_Margin'] = round(df['Revenue'] * (1 - df['Discount_%']/100) * 0.3, 2)
   df['Days_Since_Start'] = (df['Date'] - df['Date'].min()).dt.days
   return df
We design a function to generate a comprehensive e-commerce dataset that mirrors real-world business conditions. We include product categories, customer demographics, seasonal effects, and satisfaction levels, ensuring that our data is diverse and analytically rich. Check out the FULL CODES here.
print("Generating advanced e-commerce dataset...")
df = generate_advanced_dataset()
print(f"\nDataset Overview:")
print(f"Total Transactions: {len(df)}")
print(f"Date Range: {df['Date'].min()} to {df['Date'].max()}")
print(f"Total Revenue: ${df['Revenue'].sum():,.2f}")
print(f"\nColumns: {list(df.columns)}")
print("\nFirst few rows:")
print(df.head())
We execute the dataset generation function and display key insights, including total transactions, revenue range, and sample records. We get a clear snapshot of the data’s structure and confirm that it’s suitable for detailed analysis. Check out the FULL CODES here.
daily_sales = df.groupby('Date').agg({
   'Revenue': 'sum', 'Quantity': 'sum', 'Customer_Satisfaction': 'mean'
}).reset_index()


category_analysis = df.groupby('Category').agg({
   'Revenue': ['sum', 'mean'], 'Quantity': 'sum', 'Customer_Satisfaction': 'mean', 'Profit_Margin': 'sum'
}).reset_index()
category_analysis.columns = ['Category', 'Total_Revenue', 'Avg_Order_Value',
                            'Total_Quantity', 'Avg_Satisfaction', 'Total_Profit']


segment_analysis = df.groupby(['Customer_Segment', 'Region']).agg({
   'Revenue': 'sum', 'Customer_Satisfaction': 'mean'
}).reset_index()


print("\n" + "="*50)
print("DATASET READY FOR PYGWALKER VISUALIZATION")
print("="*50)
We perform data aggregations to prepare multiple analytical perspectives, including time-based trends, category-level summaries, and performance metrics for customer segments. We organize this information to make it easily visualizable in PyGWalker. Check out the FULL CODES here.
print("\n Launching PyGWalker Interactive Interface...")
walker = pyg.walk(
df,
spec="./pygwalker_config.json",
use_kernel_calc=True,
theme_key='g2'
)
print("\n PyGWalker is now running!")
print("
PyGWalker is now running!")
print(" Try creating these visualizations:")
print(" - Revenue trend over time (line chart)")
print(" - Category distribution (pie chart)")
print(" - Price vs Satisfaction scatter plot")
print(" - Regional sales heatmap")
print(" - Discount effectiveness analysis")
Try creating these visualizations:")
print(" - Revenue trend over time (line chart)")
print(" - Category distribution (pie chart)")
print(" - Price vs Satisfaction scatter plot")
print(" - Regional sales heatmap")
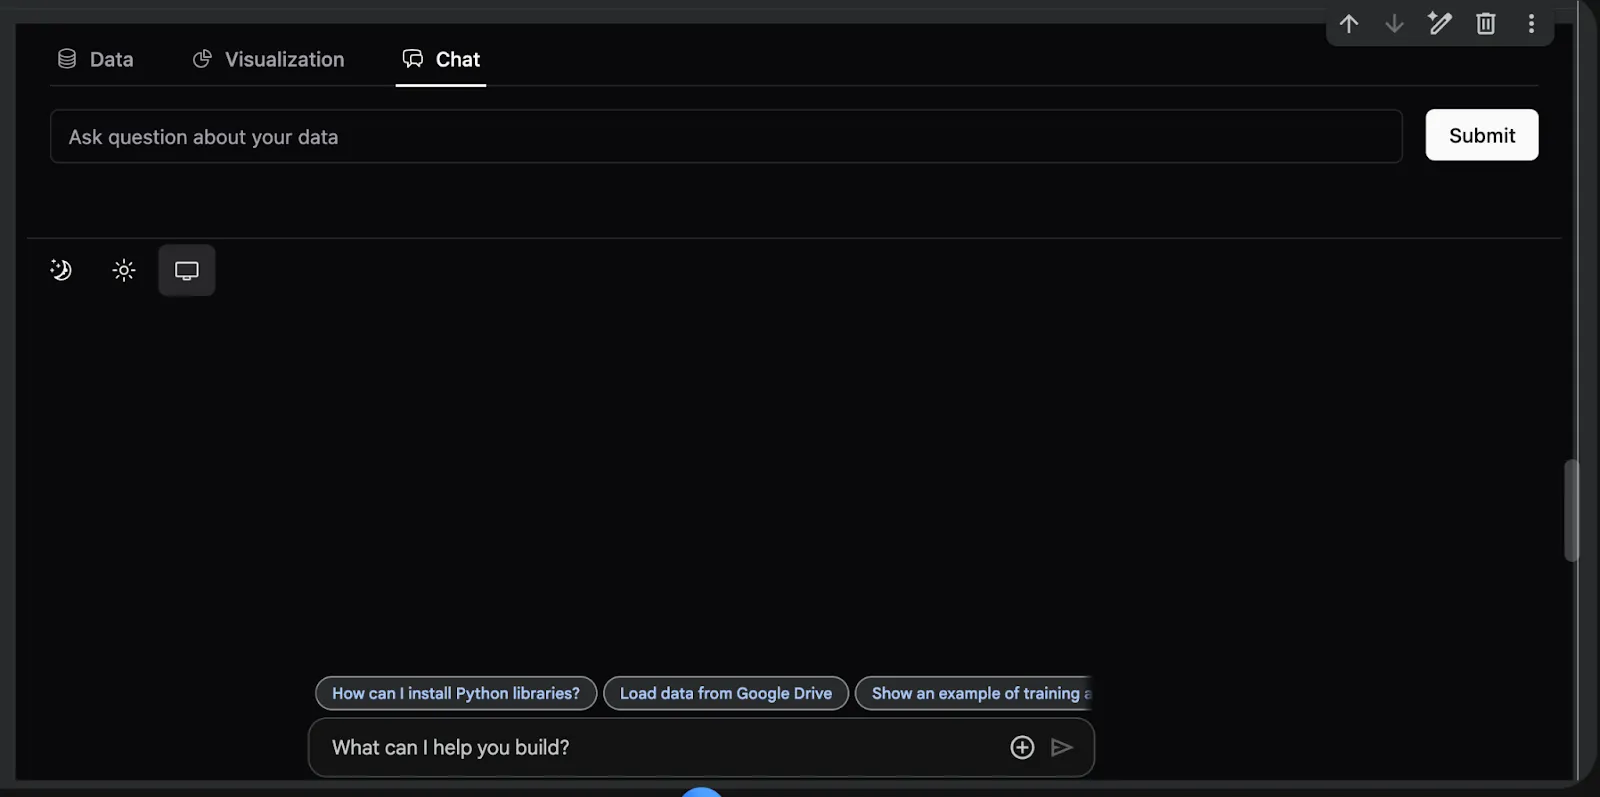
print(" - Discount effectiveness analysis")We launch the PyGWalker interactive interface to visually explore our dataset. We create meaningful charts, uncover trends in sales, satisfaction, and pricing, and observe how interactive visualization enhances our analytical understanding.


In conclusion, we developed a comprehensive data visualization workflow using PyGWalker, encompassing dataset generation, feature engineering, multidimensional analysis, and interactive exploration. We experience how PyGWalker transforms raw tabular data into rich, exploratory dashboards without needing complex code or BI tools. Through this exercise, we strengthen our ability to derive insights quickly, experiment visually, and connect data storytelling directly to practical business understanding.
Check out the FULL CODES here. Feel free to check out our GitHub Page for Tutorials, Codes and Notebooks. Also, feel free to follow us on Twitter and don’t forget to join our 100k+ ML SubReddit and Subscribe to our Newsletter. Wait! are you on telegram? now you can join us on telegram as well.
The post How to Build an End-to-End Interactive Analytics Dashboard Using PyGWalker Features for Insightful Data Exploration appeared first on MarkTechPost.
Credit: Source link