

NicoElNino/iStock via Getty Images
It was another extraordinarily buoyant period for global equity markets during the third quarter, with both US and non-US equity markets continuing to achieve new record highs as measured by broad market capitalization-weighted indices such as the S&P 500 Index (“S&P 500”), the MSCI World Index, and the MSCI EAFE Index. The S&P 500 finished the quarter up 8.12% and is up 14.83% year-to-date. As we have mentioned in past reports, popular valuation metrics such as the “Buffett Indicator” and the CAPE-Shiller P/E are now at or near record highs. And this has come on the heels of the S&P 500’s back-to-back 26% and 25% calendar year returns in 2023 and 2024. Meanwhile, the MSCI EAFE Index was up 4.77% for the quarter and soared well ahead of the S&P 500 year-to-date, with a return of 25.14%.
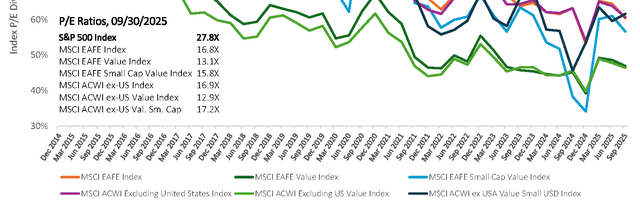
In this continued “risk on” environment, the Tweedy, Browne Funds continued to make financial progress, but trailed their benchmark indices for the quarter. In contrast, for the year-to-date period, the Funds produced returns of between 15.98% (Value Fund) and 23.17% (International Value Fund II), and in the case of the Worldwide High Dividend Yield Value Fund outperformed its respective benchmark index. While our flagship International Value Fund underperformed its primary benchmark for the year-to-date period, it significantly outperformed the hedged MSCI EAFE Index, perhaps a more apples to apples comparison for this hedged international value fund. The currency-hedged Value Fund also surpassed its hedged benchmark for the year-to- date period. The International Value Fund II had the best absolute return of the four Funds year-to-date, returning 23.17%; however, it trailed its primary benchmark, the unhedged MSCI EAFE Index, by 197 basis points.* While US equities performed extraordinarily well year-to-date, the good news for investors in the Tweedy, Browne Funds is that non-US equities, particularly European equities, have performed well in US dollars over the same period, producing returns that exceeded those of the S&P 500. As you may recall, our global funds have historically carried an overweight to European equities as valuations were typically more compelling in Europe. While currency played a significant role in the outperformance of non-US equities in US dollars, we welcome the value recognition in non-US equities that has occurred year-to-date, which in our opinion, is long overdue. Aside from currencies’ role, it is hard to know for sure what is driving this resurgence in non-US equities. We believe that perhaps the decline in so-called US exceptionalism, and for sure, a weakening US dollar, has played a significant role. In addition, we believe it could partly be due to the prospects for robust defense and infrastructure spending in Europe, and/or the valuation gap that has existed for over a decade and continues to persist between US and non-US equities (see the chart that follows). This gap remains significant despite the outperformance of non-US equities year-to-date. We believe that in a world where inflation remains persistent and interest rates are normalizing at levels far above the zero bound of the not-too-distant past, price once again matters in investing.
Relative Valuations of International Indexes vs S&p 500 Trailing P/e Ratios / P/e Ratio of S&p 500
Portfolio Attribution
Please note that the individual companies discussed herein were held in one or more of the Funds during the quarter ended September 30, 2025, but were not necessarily held in all four of the Funds. Please refer to each Fund’s portfolio page, beginning on page 7, for selected purchase and sale information during the quarter and the notes on page 16 for each Fund’s respective holdings in each of these companies as of September 30, 2025.
Results for the quarter reflected a market that continued to favor large, fast-growing companies over steadier, more moderately valued businesses. Our Fund portfolios posted positive absolute returns but generally lagged their benchmarks, which remained heavily influenced by a narrow group of highly valued growth stocks. Japan was once again among the stronger markets for our portfolios. Companies such as Subaru (OTCPK:FUJHY), Koito Manufacturing (OTCPK:KOTMY), Fuso Chemical, Nifco, and Takara Holdings (OTCPK:TKKHF) contributed positively as earnings remained resilient and a weaker yen continued to support exporters. The environment in Japan has been improving for some time, and in our view, corporate behavior there continues to move in a more shareholder-friendly direction. Several of our European holdings also added to results. Safran (OTCPK:SAFRY), the French aerospace supplier, benefited from a continued recovery in air travel and supply chain constraints limiting new narrow body airplane deliveries. Rubis (OTCPK:RBSFY), the French energy distributor, performed well as investors recognized the stability of its cash flows. Ionis Pharmaceuticals (IONS), a biotechnology company held in three of our four Funds, was another strong contributor following encouraging clinical results that helped renew investor confidence in its research pipeline. Financial holdings made a smaller but still positive contribution. National Bank of Canada (NA:CA) and DB Insurance in Korea provided some lift, and other insurers and banks in Europe and Asia performed reasonably well.
On the negative side, several of our European industrial and consumer companies faced headwinds. CNH Industrial (CNHI) and Teleperformance (OTCPK:TLPFY) both declined after issuing cautious outlooks. Heineken Holding (OTCQX:HKHHY) also detracted from performance results as near-term demand appeared softer than expected. Nestlé (OTCPK:NSRGY) was another notable detractor, and a few smaller UK holdings, including Pets at Home (OTCPK:PAHGF) and Grafton Group (OTCPK:GROUF) were weak amid continued sluggishness in the domestic UK economy. The larger branded spirits company, Diageo (DEO), also disappointed as demand for spirits, particularly from younger consumers contracted somewhat. In Asia, LG Corp (LGCOY) and Dentium both declined modestly, while Azelis Group (OTCPK:AZLGF) and Sopra Steria (OTCPK:SPSAF) gave back a portion of earlier gains. At the sector level, health care and financials were the largest positive contributors, while industrials and consumer staples detracted the most. Larger and mid-sized companies tended to fare better than small caps, a pattern that has been consistent during this period of investor preference for perceived safety and liquidity. Currency movements also influenced reported results. The US dollar strengthened modestly against most major currencies, rising slightly versus the euro and Swiss franc and more notably against the pound, yen, and Korean won. This provided a modest benefit for our hedged portfolios, the International Value Fund and the Value Fund, and a slight headwind for our unhedged funds, the International Value Fund II and the Worldwide High Dividend Yield Fund. Taken together, the quarter’s results were not atypical of what one might expect from a diversified, bottom-up, price-driven investment process. We remain focused, in large part, on companies that, in our view, combine financial strength, reasonable valuations, the capacity to weather uncertain times, and where knowledgeable insiders have been making material, free will purchases of their company’s shares.
Portfolio Activity
(A list of selected newly established positions, including additions, sales, and trims of existing positions for each Fund, is included with each Fund’s portfolio page, beginning on page 7.)
Portfolio activity was measured during the quarter, and consistent with our long-term discipline. We trimmed or sold holdings that had reached our estimates of value, and established positions in, or added to, companies we believe remained attractively priced. Among the more notable purchases were Berkeley Group Holdings (OTCPK:BKGFY) and Breedon Group (OTC:BDRGF), both in the United Kingdom. Berkeley, a well-managed homebuilder focused on London and the South East, was purchased after a pullback left its shares trading well below what we believe to be intrinsic worth. In our view, the company’s balance sheet and capital allocation remain exemplary. Breedon, an aggregates and construction materials business, was added on similar grounds. We believe its steady demand from infrastructure and repair work may provide a sound foundation over time. In Europe, we purchased Sodexo (OTCPK:SDXAY), the French food services and facilities-management company. After a period of operational restructuring, we believe that the company’s financial performance will improve, and the shares still trade, in our opinion, at an undemanding valuation. We also increased our investment in Azelis Group, a Belgian specialty-chemicals distributor that we believe continues to consolidate a fragmented market with disciplined execution.
In Japan, we initiated a position in Santec Holdings (SNTEF), a producer of optical and laser components used in communications and testing. The business, in our view, is well positioned in growing end markets, and the shares were trading at a reasonable multiple of earnings and cash flow. We added to Dentium, the Korean dental-implant manufacturer, after weakness in the share price created an opportunity to buy more of what we believe is a well- run, cash-rich company with attractive growth prospects. Smaller additions included Johnson Service Group (JNSGF), a UK textile rental and laundering company benefiting from the post-pandemic recovery in hospitality, and Nakanishi (NKNIF), a Japanese dental-equipment maker with leading positions in precision spindles and hand-held grinders. On the sell side, we realized gains in BAE Systems (OTCPK:BAESY) and Rheinmetall (OTCPK:RNMBY) after meaningful appreciation, consistent with our discipline of trimming positions as they approach our estimate of fair value. We sold Teleperformance after revisiting our assessment of their medium-term outlooks. Other sales included Babcock International (OTCPK:BCKIF), Chow Sang Sang Holdings (CHWSF), Luk Fook Holdings (OTCPK:LKFLF), Sumitomo Heavy Industries (OTCPK:SOHVY), SKF AB (OTCPK:SKFRY), and Star Micronics (SMIOF), where we believe our investment theses had largely run their course. In the Worldwide High Dividend Yield Value Fund, we added to holdings such as Arkema (OTCPK:ARKAY), Johnson Service Group, and Sodexo, and trimmed DBS Group (OTCPK:DBSDY) and BAE Systems following strong gains. The fund remains focused on companies that we believe have competitive advantages that support resilient cash generation, and attractive shareholder yields as evidenced by the payment of above average dividends and a willingness to buyback shares when their shares appear to be undervalued. Across all portfolios, these modest adjustments nudged exposures slightly toward select cyclical and mid-sized businesses in Europe and Japan, financed by trims in names that had advanced toward our intrinsic valuation estimates. The essential character of our portfolios remains unchanged: a collection, in large part, of competitively advantaged, financially sound, cash-generating businesses that we believe on a group basis trade at discounts to conservative estimates of underlying intrinsic value.
Tweedy News
As mentioned in our Q2 Commentary, Tweedy Browne filed for exemptive relief from the SEC to allow for the establishment of ETF share classes across all four of our mutual funds. We were one of over 50 mutual fund investment managers who submitted applications for this exemptive relief and have been waiting for SEC approval. We are pleased to report that there is good news on this front. Just after quarter-end, on October 3rd, the US Securities and Exchange Commission indicated it intended to grant the exemptive relief to the quantitative firm, Dimensional Fund Advisors, in the coming weeks unless the Commission orders a hearing. In our view, this is a potential game-changer for the traditional mutual fund industry. Assuming the approvals come through as anticipated, it will likely trigger a wave of new ETF launches. We are excited about the opportunity to offer our shareholders a choice when it comes to investing in our funds. As we said in our Q2 Commentary, while we have always tried to manage our funds in a tax-efficient manner, it was impossible to ignore the additional tax benefits associated with the ETF “redemption-in-kind” fund structure. While it’s still not yet clear whether the SEC will grant us this relief, the odds have certainly increased, and such an outcome now appears more likely. Stay tuned.
Outlook
Looking ahead, we are encouraged by the resurgence of non-US equity returns, and believe our funds are extraordinarily well positioned for whatever may lie ahead. If there is the beginning of an actual sea change in our global equity markets favoring non-US equities, our funds will likely continue to participate. If, on the other hand, global equity markets face a long overdue come-uppance, we believe our funds are likely to hold up relatively better than broad capitalization-weighted indices. In our long experience, our funds have typically gained the most ground against indexes in challenging investment environments. While there are no guarantees, in the event of a downturn, we are hopeful that pattern will persist. As mentioned in our semi-annual report, we believe that a diversified portfolio of well-capitalized, competitively advantaged companies purchased at sensible valuations offers the best defense against market uncertainty and resultant volatility. If the past is prologue, that should continue to serve us, and our investors, well over time.
We thank you for your continued trust and confidence.
Roger R. de Bree, Andrew Ewert, Frank H. Hawrylak, Jay Hill, Thomas H. Shrager, John D. Spears, Robert Q. Wyckoff, Jr.
Investment Committee*, Tweedy, Browne Company LLC
* Each member of the Investment Committee is a current investor in one or more of the Funds.
AVERAGE ANNUAL TOTAL RETURNS AS OF SEPTEMBER 30, 2025
Credit: Source link