

mohd izzuan/iStock via Getty Images
“As for the future, your task is not to foresee it but to enable it.”
-Antoine de Saint-Exupéry
Dear Client,
Our “all-seasons” approach to portfolio construction helped weather the short but sharp market storm in early 2025. While the popular “Magnificent 7” group of stocks fell by 30% from their December 17, 2024 peak to the April 8, 2025 low, the Grey Owl All-Seasons (GOAS) portfolio was down less than 3% at its worst point in early April.
Importantly, this resilience didn’t come at the expense of missing out on gains during stronger markets. In the first quarter, GOAS returned +1.5%, ahead of the benchmark’s +0.5%. Since mid-April, we’ve participated in the rebound as well, finishing the first half of the year with a +4.3% return—comfortably ahead of short-term Treasury bills (+2.0%) and not far behind the traditional 60/40 benchmark (+7.8%).
Minimizing drawdowns, outperforming short-term bonds by several hundred basis points, and participating meaningfully in risk-on rallies—that’s exactly what the GOAS strategy is designed to do.
More specifics below on the present environment and our current positioning, but first a more detailed review of the performance of the “primary” asset classes1 at the halfway mark of 2025.
Every major asset class delivered positive returns in the first half of 2025. Risk-oriented assets performed well, with global equities up +10.3% and U.S. equities rising +6.1%. Commodities posted a modest gain of +1.2%. Even traditional “safe-haven” assets saw gains—long-dated U.S. Treasury bonds rose +2.9%, while gold was the standout performer, surging +25.9%. Obviously this came with significant volatility (something we aim to dampen). Given the setup described below and the composition of market structure (what entities buy and sell on a daily basis), we would expect periods of extreme volatility to continue.
Economic Growth
Economic growth continued its mild deceleration through the second quarter. To highlight this point, we return to ISM Manufacturing PMI we show most quarters. The manufacturing economy has remained in contractionary mode now for most of the last 24 months. Recall that the (PMI) summarizes in a single data point the state of the US economy. The PMI is a “diffusion index” which aggregates survey data from decision makers throughout the manufacturing economy. The questions are around the managers’ expectations (e.g. “do you plan to acquire more or less inventory next month compared to this month) and are thus a leading indicator of economic activity.
Figure 1 – US ISM Manufacturing PMI monthly https://ycharts.com/indicators/us_pmi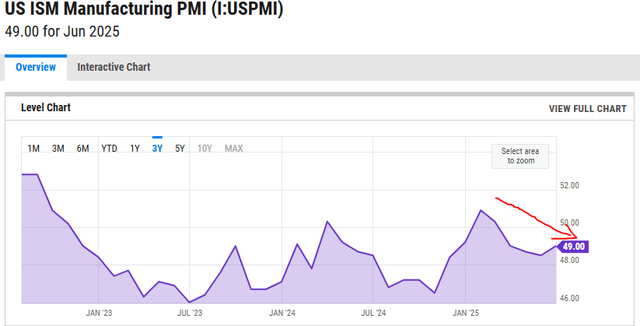
Further, Hedgeye’s Real GDP projections model shows continued deceleration through the current (third) quarter. Again, this is mild deceleration and real GDP does remain positive. More, nominal GDP is set to reaccelerate as inflation picks back up (see the next section). This creates an environment favorable to some risk-on assets, especially those that are commodity related.
Figure 2 – US ISM Manufacturing PMI monthly https://ycharts.com/indicators/us_pmi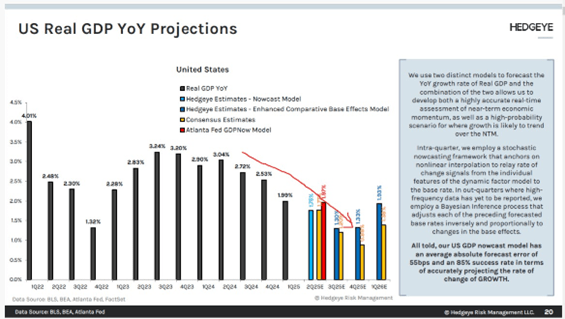
Inflation
Last quarter, we highlighted the February to April drop in measured inflation and inflation expectations. Then, we pointed out that inflation was likely to reaccelerate: “When market participants start to anticipate this reacceleration, securities will react: some winners will become losers and vice versa. We aim to tilt the portfolio accordingly.” It has.
The 5-Year Breakeven2 has now been climbing since mid-April.
Figure 3 -5-Year Breakeven www.tradingview.com 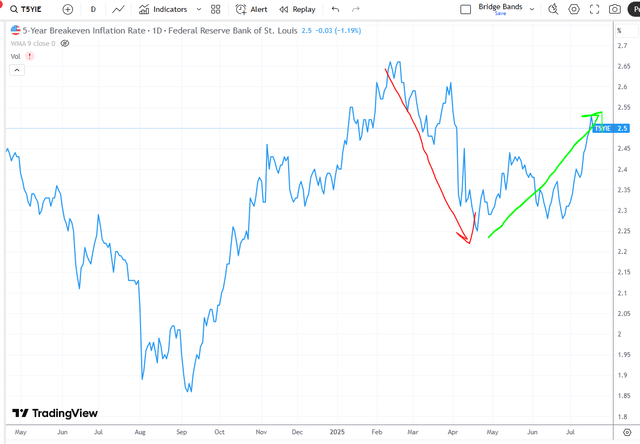
Pulling from Hedgeye’s projection models again, we see that Consumer Price Index (CPI) remains set to continue the recent reacceleration through the back half of the year. As with the growth deceleration, this inflation acceleration looks to be mild. Either way, as we outline below, our portfolio today is weighted more toward commodities and commodity-oriented equities in anticipation of this trend persisting.
Figure 4 – Inflation Projections ( www.hedgeye.com)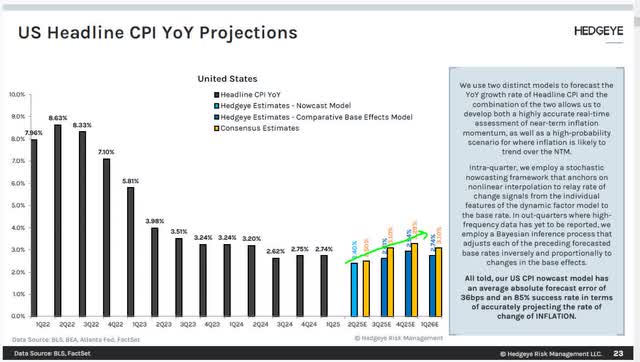
Market Signals
Last quarter we noted that “the rebound in positive market internals post the November 2024 election was short lived. With a seemingly exhausted rally in the Mag7 and the uncertain introduction of tariffs, US equity markets moved into “risk off” mode.” But we then emphasized a key detail “Interestingly, it is only an increase in selling pressure that is damaging internals. Buying power has remained constant through the turbulence.” That was an important sign.
We continued by quoting Lowry’s analysis of the data:
Thus far in April, the market has exhibited great volatility. However, rather than suffering random spasms, a series of days of urgent selling were followed by days of urgent buying to imply that Supply was exhausted and Demand was beginning to return. The chain of events was not typical of major correction bottoms, but there was enough evidence to suggest that the worst was over, and the ball is now in the bulls’ court.
And then we concluded: “In other words, we may have seen the worst and need to watch market signals carefully, but the atypical pattern means uncertainty remains.”
As appeared likely, subsequent to our letter, buying power has resumed its growth and selling pressure has faded creating a positive backdrop for risk-assets.
Figure 5 – https://www2.lowryondemand.com/members/markets/marketchart.cfm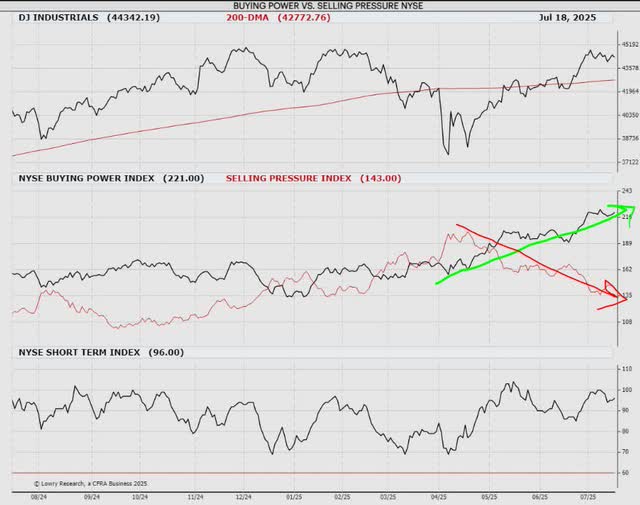
Today Lowry’s posits:
With an improving balance of Demand and Supply, supportive market breadth and stock participation, as well as a more risk-on offensive stance, pullbacks or consolidation periods are likely to remain shallow and short-lived. The S&P 500 recently took a brief pause to work off its overbought conditions before rallying to another new all-time high on July 17. However, more importantly, the weight of evidence in Lowry’s core indicators continues to reflect a bull market that is likely still heading higher in the weeks and months ahead. Therefore, a bullish stance remains warranted in this resilient market, particularly as signs of technical deterioration remain absent.
Tactical Opportunities
We construct the Grey Owl All-Seasons portfolio based on an all-seasons design with tilts according to the prevailing economic environment. In addition, we occasionally take advantage of tactical opportunities. During the past quarter, two such tactical opportunities presented themselves.
As inflation continued to push prices higher and the threat of tariffs introduced the threat of further price increases, dollar stores presented an excellent opportunity for investment. As the low-cost (and in some towns the “only”) provider at scale, both Dollar General (DG) and Dollar Tree (DLTR) can raise prices to increase both their top and bottom lines. Leading up to this point, both stocks were down significantly. DG had fallen over 72% from an all-time-high in late 2022. We invested in both in early April. We sold DG in early July realizing a gain of over 28% in a few months. We continue to hold DLTR—in addition to its ability to take price, the company is undergoing a transformational change with the Family Dollar spinoff.
Figure 6 – www.tradingview.com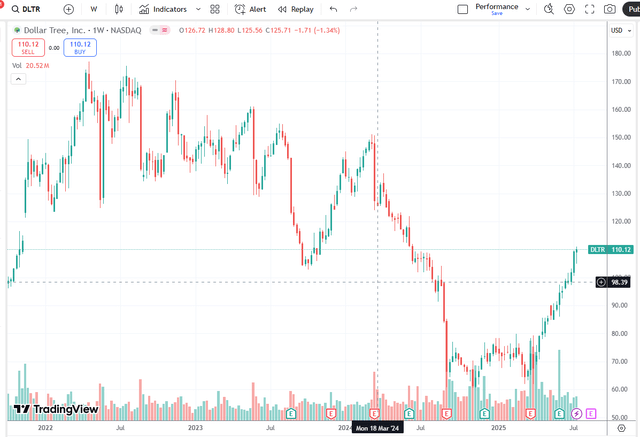
In mid-June when tensions with Iran escalated, Israel’s economy and stock market had been in a positive upward trend. Headlines caused a very rapid drop in the Israeli stock market over the course of four or five days. Contemplating a short-lived threat of escalating conflict and a return to focusing on the accelerating economy (this has been the pattern), we made an investment on June 13 which we sold on July 14 for a 13% gain.
Figure 7 – www.tradingview.com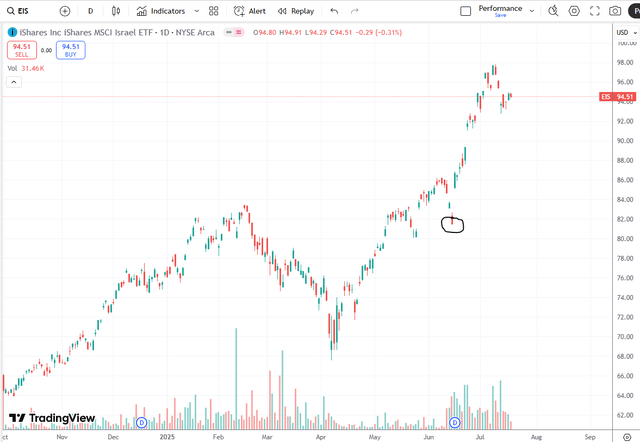
Current Positioning
Our current portfolio composition is very balanced (i.e. “all-seasons”). Across the portfolio there is an inflationary bent. Fixed income is weighted to inflation protected securities, curve steepeners, and high yield. US equity exposure is weighted toward growth and commodity producers. Our additional equity exposure focuses on Europe where both inflation and growth are accelerating. Of course, given the inflationary acceleration, we have direct commodity exposure through gold, silver, Bitcoin, and uranium.
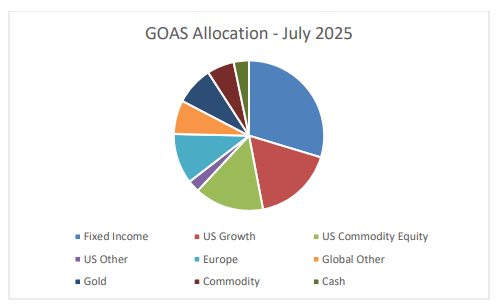
This balance—rooted in our all-seasons framework and adjusted for the realities of today— embodies our core belief: we don’t try to predict the future, we position to enable success across many possible futures.
As always, if you have any thoughts regarding the above ideas or your specific portfolio that you would like to discuss, please feel free to call us at 1-888-GREY-OWL.
Sincerely,
Grey Owl Capital Management
|
This newsletter contains general information that is not suitable for everyone. The information contained herein should not be construed as personalized investment advice. Past performance is no guarantee of future results. There is no guarantee that the views and opinions expressed in this newsletter will come to pass. Investing in the stock market involves the potential for gains and the risk of losses and may not be suitable for all investors. Information presented herein is subject to change without notice and should not be considered as a solicitation to buy or sell any security. Any information prepared by any unaffiliated third party, whether linked to this newsletter or incorporated herein, is included for informational purposes only, and no representation is made as to the accuracy, timeliness, suitability, completeness, or relevance of that information. The stocks we elect to highlight each quarter will not always be the highest performing stocks in the portfolio, but rather will have had some reported news or event of significance or are either new purchases or significant holdings (relative to position size) for which we choose to discuss our investment tactics. They do not necessarily represent all of the securities purchased, sold or recommended by the adviser, and the reader should not assume that investments in the securities identified and discussed were or will be profitable. A complete list of recommendations by Grey Owl Capital Management, LLC may be obtained by contacting the adviser at 1-888-473-9695. Grey Owl Capital Management, LLC (“Grey Owl”) is a Virginia registered investment adviser with its principal place of business in the Commonwealth of Virginia. Grey Owl and its representatives are in compliance with the current notice filing requirements imposed upon registered investment advisers by those states in which Grey Owl maintains clients. Grey Owl may only transact business in those states in which it is notice filed or qualifies for an exemption or exclusion from notice filing requirements. This newsletter is limited to the dissemination of general information pertaining to its investment advisory services. Any subsequent, direct communication by Grey Owl with a prospective client shall be conducted by a representative that is either registered or qualifies for an exemption or exclusion from registration in the state where the prospective client resides. For information pertaining to the registration status of Grey Owl, please contact Grey Owl or refer to the Investment Adviser Public Disclosure web site ( www.adviserinfo.sec.gov). For additional information about Grey Owl, including fees and services, send for our disclosure statement as set forth on Form ADV using the contact information herein. Please read the disclosure statement carefully before you invest or send money. Footnotes 1 We refer to US equities, long-dated US Treasury bonds, gold, and commodities as “primary” asset classes borrowing the language of HCWE & Company. These four assets best capture two variables that explain a significant amount of asset price movement: global growth and inflation. This framework is the basis for a permanent portfolio, an “all-season” portfolio, risk-parity, etc. US equities and commodities are “risk” assets, while US Treasury bonds and gold are “haven” assets. Returns are measured on a total return basis using index exchange traded funds (ETFs): SPY for the S&P 500, ACWI for the MSCI All-Country World Index, GSG for the S&P GSCI Commodity Index, TLT for 20+ Year Treasury Bond index (i.e. “long-dated” US Treasury bonds), and GLD for gold. 2 From TradingView: “The 5 Year TIPS/Treasury Breakeven Rate is calculated as the difference between the 5 year treasury rate and the 5 year treasury inflation-indexed security rate. Market participants use this value as what they believe the expected inflation should be in the next 5 years, on average.” |
Original Post
Editor’s Note: The summary bullets for this article were chosen by Seeking Alpha editors.
Credit: Source link