


monsitj
Dear Investor:
During the third quarter, Third Point (OTCPK:TPNTF) returned 3.9% in the flagship Offshore Fund.

|
1 Through September 30, 2024. Please note there is a one-month lag in performance reflected for the CS HF Event-Driven Index 2 Annualized Return from inception (December 1996 for TP Offshore and quoted indices). PLEASE SEE THE NEW SERIES RETURNS AT THE END OF THIS DOCUMENT. |
The top five winners for the quarter were a private position in R2 Semiconductor, Pacific Gas and Electric Co. (PCG), Vistra Corp. (VST), KB Home (KBH), and Danaher Corp. (DHR)
The top five losers for the quarter, excluding hedges, were Bath & Body Works Inc. (BBWI), Amazon.com Inc. (AMZN), Advance Auto Parts Inc. (AAP), Alphabet Inc. (GOOG,GOOGL) and Microsoft Corp. (MSFT)
REVIEW AND OUTLOOK1
During the third quarter, Third Point Offshore generated gains of nearly 4%, bringing year- to-date returns to 13%, net of fees and expenses. Global equity markets continued their strong performance, but returns were driven by substantially more market breadth than over the previous year and a half. The “Magnificent Seven” trailed the broader market (albeit modestly) for the first time since Q4 2022. Rate sensitive stocks and cyclicals significantly outperformed as the market shifted its focus to the Fed’s long-awaited easing cycle. As we highlighted in our Second Quarter letter, our portfolio has a broad range of investment themes outside of large cap tech. These types of investments in industrials, utilities, materials, and other housing-sensitive stocks led the portfolio for Q3.
For most of the nearly thirty years I have run Third Point, the market has been inexorably climbing a wall of worry. At times, the worry turns to despair, most recently in the beginning of August, when the Nikkei (NKY:IND) inexplicably tanked roughly 20% in a few days and volatility in the US exploded to nearly 70 from 16, all while US markets dropped 6%. Many pundits saw this as a warning that the market had more room to drop and that, in the best case, stocks had become “un-investable” through the election. While we took our lumps for a few days, we stayed committed to our positions, took the view that the market rotation would continue, and increased our investments in event-driven and value-oriented stocks.
Considering political developments over the past few weeks, we believe that the likelihood of a Republican victory in the White House has increased, which would have a positive impact on certain sectors and the market overall. We believe the proposed “America First” policy’s tariffs will increase domestic manufacturing, infrastructure spending, and prices of certain materials and commodities. We also believe that a reduction in regulation generally and especially in the activist antitrust stance of the Biden-Harris administration will unleash productivity and a wave of corporate activity. Accordingly, we have increased certain positions that could benefit from such a scenario via both stock and option purchases and continue to shift our portfolio away from companies that will not. Whatever the outcome of the Presidential election, we have carefully studied the Senate races and believe that the Republicans will establish a majority, limiting the economic downside of a “Blue Sweep” which could theoretically usher in crushing taxes, stifling regulations, and a headwind to growth.
In the economy, we see no evidence of recession, slowing inflation, and a real interest rate that still needs to come down. We believe healthy consumer spending and active levels of individual investing should provide a liquidity backdrop to sustain market levels. We think this setup is a particularly good one for event-driven investing, particularly since most of our competitors in this area have retired or moved on. The potential for risk arbitrage transactions and corporate activity could usher in a golden age for the strategy. At this point, our gross exposures are low, we have modest nets, are well positioned in our current portfolio, and can deploy fresh capital as opportunities arise.
Equity Updates
DSV (OTCPK:DSDVF)
During the Third Quarter, we initiated a new position in the Danish freight forwarder DSV. DSV has come a long way from its origins as a Nordic road-hauler to become the world’s third largest freight forwarder, with a formidable track record of consolidating the fragmented global freight forwarding industry. We believe the company has an impressive culture that is systems-driven and returns-focused. DSV has generated an approximately 20% EPS CAGR over the past 10 years and is widely recognized as the best-in-class operator, with industry- leading growth and profit margins.
DSV emerged as the leading bidder in the auction of DB Schenker, a subsidiary of German state-owned Deutsche Bahn AG, and one of its largest competitors. DB Schenker is similar in size to DSV but only half as profitable. We believe the integration and synergy capture expected from this combination will follow a proven playbook and drive earnings accretion in excess of 30%. We have analyzed DSV’s many acquisitions and observed that they follow a pattern of swiftly migrating the target onto DSV’s IT system, culling low-margin business, and rightsizing the cost structure, resulting in the target’s margins reaching DSV’s best-in- class margins within two years.
The DB Schenker acquisition is taking place at an interesting time. Following a period of post-COVID earnings normalization and a CEO change, DSV’s stock was trading at an approximate 20% discount to both its lower-growth peers and its historical multiple. Following the deal, DSV will be the largest player in an industry in which scale brings tangible cost and network benefits. An example of this privileged competitive positioning is that DSV was selected as the exclusive logistics provider for Saudi Arabia’s NEOM project. We believe the joint venture between DSV and Saudi Arabia will provide end-to-end supply chain management, develop transport and logistic assets, and grow the company’s earnings power by about 15% by 2028.
We have spent time with Jens Lund, DSV’s long time COO/CFO who became CEO earlier this year and have found him to be laser-focused on creating shareholder value. Mr. Lund made a compelling case that rising complexity in global supply chains will benefit DSV, as it monetizes its unique network that guarantees capacity and on-time deliveries. In the freight forwarding industry, simple load, A-to-B transportation is barely profitable. The real money is made from value-added services such as customs clearance, load consolidation and intervention when problems occur, a core competency of DSV. We believe DSV can earn more than 100 DKK per share in 2027 and see significant upside for one of Europe’s best companies.
Cinemark (CNK)
Earlier this year we took a stake in Cinemark, the third largest movie theater chain in the U.S. We believe Cinemark is poised for underappreciated growth over the next few years as the supply of theatrical releases rebounds from pandemic- and strike-related headwinds. In addition, we believe Cinemark will gain share from undercapitalized competitors.
There is no shortage of skeptics about the move theater business. In 2020 the outlook for domestic cinemas looked bleak: the rapid rise of streaming, combined with behavior changes from the pandemic, cast doubt on whether people would ever go to theaters again. Regal Cinemas filed for bankruptcy. AMC became a meme stock.
Against this inauspicious backdrop, Cinemark has demonstrated resilient financial performance. Consider that in 2023, counterintuitively, Cinemark reported higher free cash flow than they did in the two years prior to the pandemic. Yet, Cinemark stock entered 2024 trading 70% below pre-pandemic levels (a mid-single digit multiple on trailing 12-month free cash flow), suggesting market participants feared free cash flow would drop precipitously and never recover. We disagree with this view and believe the multi-year outlook for Cinemark has never been more robust.
Despite the recent success of films such as “Inside Out 2”, 2024 industry revenues are expected to finish at approximately $8.5 billion, over 20% below pre-pandemic levels. While many in the market attribute this to changing consumer preferences, the data demonstrates theaters are a supply-driven industry (more films equal more foot traffic), and we believe the key driver of weak box office revenues has been a 20% decrease in widescreen theatrical releases since 2019. Importantly, we believe that this is driven by cyclical factors, namely labor stoppages from the pandemic and subsequently the strikes, rather than secular factors. Over the past three years, forays into exclusive streaming and day-and-date releases have proven too unprofitable, and the “event” aspect of a theatrical release has proven critical to securing top talent and creating franchise IP that can drive future earnings. As a result, all six major Hollywood studios have committed to ramp volume back up to pre-COVID levels, and even pureplay streamers like Amazon and Apple (AAPL) have begun releasing films exclusively in theaters. We expect supply to rebound next year and reach the pre-COVID level by 2026, which we expect to drive a full recovery in box office revenues as modestly lower per-film attendance is offset by price increases and growth in concession revenues. In our view, transient headwinds from the 2023 Hollywood strikes were masking this important secular shift in film supply, which gave us the opportunity to initiate the investment at a dislocated valuation.
Cinemark’s earnings outperformance versus its peers through the pandemic has not been an accident; while AMC and Regal have been closing screens and underinvesting to preserve liquidity, Cinemark used what we see as a strong balance sheet and relentless focus on cost efficiencies to sustain maintenance capex in their theaters despite the challenged operating backdrop. As a result, the company has taken over 100 bps of market share, a trend we see as sustainable as peers continue to rationalize their footprint despite an improving market.
Given the significant recovery in box office, potential for continued share gain and high operating leverage of the business, we think Cinemark can generate over $4 of FCF/share in 2026, which is meaningfully higher than pre-pandemic levels and should grow in the following years. The company announced it will lay out its long-term capital allocation strategy in early 2025, including a re-introduction of a dividend, which should be supportive of a continued re-rating in the shares.
Credit Updates
Corporate Credit
Third Point’s corporate credit book generated a 3.5% gross return (3.4% net) during the quarter, contributing 50 basis points to performance. That puts year-to-date performance at +8.3% gross (8.2% net), in line with the high yield index. The summer proved anything but cruel for high yield, with the market returning 5.3% during the quarter, in line with the strong performance of the S&P 500. Spreads tightened marginally with most of the return driven by the decline in interest rates.
While some economic activity has been showing signs of slowing, the defensive composition of the current high yield market with a high mix of higher quality credit and short duration has let the rates tailwind overwhelm such concerns. The lowest quality sectors of the market have performed best, fueled by both soft/no landing expectations, as well as two positive events in the beleaguered telecom space. Telecom/cable have been poor performers year to date due to overhang from the growth of FWA (aka “wireless cable”) and increased fiber building, however the sector re-rated materially on two deals. First, Lumen Technologies (LUMN) announced that its Level 3 (LVLT) subsidiary was doing a fiber infrastructure build to support AI growth. Our aversion to secular decline (most of LUMN is melting copper infrastructure) kept us out of the situation but the AI fairy dust resulted in a massive rerating of LUMN debt and equity. These higher security prices in turn facilitated several moves to refinance portions of the capital structure and extend the runway.
Second, Verizon (VZ) announced a deal to acquire Frontier Communications (FYBR), a transaction which the fund benefited from by virtue of its investment in FYBR debt. This transaction, aimed at increasing’s VZ fiber footprint, has led to broad revaluation of fiber retail networks that we think is appropriate. While we continue to expect to see FWA rapidly erode non-upgraded cable and especially copper’s share of the low-end broadband market, the VZ deal underscores the value of the higher end footprint.
Much has been written about “creditor on creditor violence” – liability management deals where issuers are able to reduce their cost of capital or extend liquidity runways by offering a subset of creditors a chance to move up the capital stack at the expense of their brethren. These are frequently less than zero sum deals for creditors and primarily benefit financial sponsors, and a large number end up restructuring anyway after paying enormous fees to lawyers and advisors. As a result, we are seeing a rising number of creditor “co-op agreements”, which serve to prevent sponsors from manipulating creditors. While we have generally been very careful to position ourselves on the winning side of these skirmishes, we are pleased to see the rise of these co-op agreements. Co-ops can make investing in highly stressed situations more attractive because you can trust that a senior obligation does not get leapfrogged by a junior obligation. Additionally, it seems likely that these co-ops will accelerate the pace of restructurings, since sponsors will have limited options to buy time to avoid equity write-offs.
While the high yield market has rallied, we have continued to find opportunity in a few areas. We have bought into several credits that have gone through liability management deals. These businesses were improving, and recapitalization was comprehensive enough to “fix” the balance sheet. We are also finding value in several loan-only structures that have lagged the rally in the high yield market.
Structured Credit
The Structured Credit portfolio contributed 20 basis points in the quarter, driven by Treasuries and credit spreads rallying. While the Treasury market has likely overestimated the magnitude of potential Fed rate cuts for this year, we took advantage of that market window and exercised our call rights on eight reperforming mortgage deals this quarter. We priced a new mortgage securitization in August with AAA’s pricing inside of 5%, closer to investment grade yields we saw in 2019 and early 2020. As insurance companies and private credits funds actively look for investment grade risk, we have been able to access, in our view, attractive cost of funds across structured credit loans. Given the decline in new mortgage originations and newly issued mortgage-backed securities, we have seen an improvement in the technical backdrop for existing securities and loans. We believe this dynamic gives us an advantage as we continue to sell and optimize our existing mortgage portfolio.
On the ABS front, yields have continued to compress across all asset classes. Spreads have remained largely unchanged on our rental car ABS portfolio, which we bought earlier this year at double digit yields. This has been a positive trade for the portfolio as we realize significant carry each month. We have been monetizing our ABS positions into this credit spread tightening and are spending more time on CLOs and CMBS as credit events start to play out.
As we face geopolitical uncertainty and a volatile interest rate environment, we anticipate interesting investment opportunities in the Fourth Quarter as investors look to protect a solid 2024 performance.
Private Position Update: R2 Semiconductor
In March, we disclosed that we were supporting R2 Semiconductor, a private company in our Third Point ventures portfolio that we invested in over 15 years earlier, as it sought to enforce its patented technology against Intel. The technology, developed by R2’s Founder David Fisher, relates to integrated voltage regulation, which plays an essential part in reducing power consumption by microchips while maintaining product reliability.
At the end of August, Intel announced that its dispute with R2 had been fully settled in all jurisdictions. The terms are confidential, but we are pleased with the outcome, which resulted in a significant gain in the position for the quarter.
Business Updates
Matthew Ressler joined Third Point’s private credit team in Q3. Prior to joining Third Point, Mr. Ressler spent four years at Apollo Global Management as an investor in the Private Equity Group, with a focus in the technology, industrials and consumer sectors. Mr. Ressler also previously worked at Moelis & Company as an Associate in the firm’s Investment Banking division after beginning his career at JPMorgan Chase. Mr. Ressler holds an MBA from Harvard Business School and a B.A from Dartmouth College.
Ted Smith-Windsor joined Third Point in Q3, focusing on credit investment opportunities. Prior to joining Third Point, Mr. Smith-Windsor worked at Silver Point Capital where he focused on investments in distressed credit and special situations. He began his career at CPPIB where he focused on investments in private equity and credit. Mr. Smith-Windsor is a graduate of the University of Toronto, where he earned a B. Comm. in Finance and Economics.
Maureen Hart joined Third Point in Q3 as Head of Consultant Relations. Prior to joining Third Point, Ms. Hart was a Partner at Albourne America. Over her 12 years at Albourne, she oversaw many of the firm’s North American clients, managed a global 50-person team, and led the firm’s cross-selling initiative. Ms. Hart began her career in Investor Relations at FrontPoint Partners, covering equity long/short funds. She graduated from the University of Connecticut with a B.A. in English.
Thomas Anglin joined Third Point in Q3 as Head of Marketing and Business Development for the Asia-Pacific region. Prior to joining Third Point, Mr. Anglin was a Managing Director at Goldman Sachs in Hong Kong where he oversaw coverage of hedge fund managers in Asia and was responsible for Goldman Sachs’ Australian Prime Brokerage business. Previously, he held senior leadership positions at Goldman Sachs in New York, UBS Investment Bank in New York and Sydney, and was an equities and commodities trader at Ospraie Management. Mr. Anglin started his career in equity derivatives sales and trading at Macquarie Bank in Australia and moved to New York with Macquarie in 2000. He received a B.Com from Monash University in Melbourne and is a CFA charterholder.
Sincerely,
Daniel S. Loeb CEO
|
The information contained herein is being provided to the investors in Third Point Investors Limited (the “Company”), a feeder fund listed on the London Stock Exchange that invests substantially all of its assets in Third Point Offshore Fund, Ltd (“Third Point Offshore”). Third Point Offshore is managed by Third Point LLC (“Third Point” or “Investment Manager”), an SEC-registered investment adviser headquartered in New York. Third Point Offshore is a feeder fund to the Third Point Offshore Master Fund L.P. in a master-feeder structure. Third Point LLC , an SEC registered investment adviser, is the Investment Manager to the Funds. Unless otherwise specified, all information contained herein relates to the Third Point Offshore Master Fund L.P. inclusive of legacy private investments. P&L and AUM information are presented at the feeder fund level where applicable. Sector and geographic categories are determined by Third Point in its sole discretion. Performance results are presented net of management fees, brokerage commissions, administrative expenses, and accrued performance allocation, if any, and include the reinvestment of all dividends, interest, and capital gains. While performance allocations are accrued monthly, they are deducted from investor balances only annually or upon withdrawal. From the inception of Third Point Offshore through December 31, 2019, the fund’s historical performance has been calculated using the actual management fees and performance allocations paid by the fund. The actual management fees and performance allocations paid by the fund reflect a blended rate of management fees and performance allocations based on the weighted average of amounts invested in different share classes subject to different management fee and/or performance allocation terms. Such management fee rates have ranged over time from 1% to 2% per annum. The amount of performance allocations applicable to any one investor in the fund will vary materially depending on numerous factors, including without limitation: the specific terms, the date of initial investment, the duration of investment, the date of withdrawal, and market conditions. As such, the net performance shown for Third Point Offshore from inception through December 31, 2019 is not an estimate of any specific investor’s actual performance. For the period beginning January 1, 2020, the fund’s historical performance shows indicative performance for a new issues eligible investor in the highest management fee (2% per annum) and performance allocation (20%) class of the fund, who has participated in all side pocket private investments (as applicable) from March 1, 2021 onward. The inception date for Third Point Offshore Fund Ltd is December 1, 1996. All performance results are estimates and past performance is not necessarily indicative of future results. The net P&L figures are included because of the SEC’s new marketing rule and guidance. Third Point does not believe that this metric accurately reflects net P&L for the referenced sub-portfolio group of investments as explained more fully below. Specifically, net P&L returns reflect the allocation of the highest management fee (2% per annum), in addition to leverage factor multiple, if applicable, and incentive allocation rate (20%), and an assumed operating expense ratio (0.3%), to the aggregate underlying positions in the referenced sub-portfolio group’s gross P&L. The management fees and operating expenses are allocated for the period proportionately based on the average gross exposures of the aggregate underlying positions of the referenced sub-portfolio group. The implied incentive allocation is based on the deduction of the management fee and expense ratio from Third Point Offshore fund level gross P&L attribution for the period. The incentive allocation is accrued for each period to only those positions within the referenced sub-portfolio group with i) positive P&L and ii) if during the current MTD period there is an incentive allocation. In MTD periods where there is a reversal of previously accrued incentive allocation, the impact of the reversal will be based on the previous month’s YTD accrued incentive allocation. The assumed operating expense ratio noted herein is applied uniformly across all underlying positions in the referenced sub-portfolio group given the inherent difficulty in determining and allocating the expenses on a sub-portfolio group basis. If expenses were to be allocated on a sub- portfolio group basis, the net P&L would likely be different for each referenced investment or sub-portfolio group, as applicable. While the performances of the fund has been compared here with the performance of well-known and widely recognized indices, the indices have not been selected to represent an appropriate benchmark for the fund whose holdings, performance and volatility may differ significantly from the securities that comprise the indices. Past performance is not necessarily indicative of future results. All information provided herein is for informational purposes only and should not be deemed as a recommendation to buy or sell securities. All investments involve risk including the loss of principal. This transmission is confidential and may not be redistributed without the express written consent of Third Point LLC and does not constitute an offer to sell or the solicitation of an offer to purchase any security or investment product. Any such offer or solicitation may only be made by means of delivery of an approved confidential offering memorandum. Specific companies or securities shown in this presentation are meant to demonstrate Third Point’s investment style and the types of industries and instruments in which we invest and are not selected based on past performance. The analyses and conclusions of Third Point contained in this presentation include certain statements, assumptions, estimates and projections that reflect various assumptions by Third Point concerning anticipated results that are inherently subject to significant economic, competitive, and other uncertainties and contingencies and have been included solely for illustrative purposes. No representations express or implied, are made as to the accuracy or completeness of such statements, assumptions, estimates or projections or with respect to any other materials herein. Third Point may buy, sell, cover, or otherwise change the nature, form, or amount of its investments, including any investments identified in this letter, without further notice and in Third Point’s sole discretion and for any reason. Third Point hereby disclaims any duty to update any information in this letter. This letter may include performance and other position information relating to once activist positions that are no longer active but for which there remain residual holdings managed in a non-engaged manner. Such holdings may continue to be categorized as activist during such holding period for portfolio management, risk management and investor reporting purposes, among other things. Information provided herein, or otherwise provided with respect to a potential investment in the Funds, may constitute non-public information regarding Third Point Investors Limited, a feeder fund listed on the London Stock Exchange, and accordingly dealing or trading in the shares of the listed instrument on the basis of such information may violate securities laws in the United Kingdom, United States and elsewhere. New Series (Excludes Legacy Private Investments)3 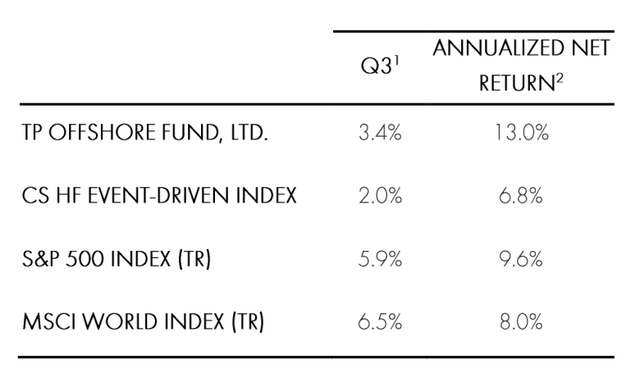 1 Through September 30, 2024. Please note there is a one-month lag in performance reflected for the CS HF Event-Driven Index 2 Annualized Return from inception (December 1996 for TP Offshore and quoted indices). 3“New Series (Excludes Legacy Private Investments)” uses the existing series track record form inception through May 31, 2023. Returns from June 1, 2023 and onward exclude legacy private investments. |
Original Post
Editor’s Note: The summary bullets for this article were chosen by Seeking Alpha editors.
Editor’s Note: This article discusses one or more securities that do not trade on a major U.S. exchange. Please be aware of the risks associated with these stocks.
Credit: Source link


