
hapabapa
J.Jill, Inc. (NYSE:JILL), the women’s apparel retailer with operations in the United States, reported the company’s fiscal Q2 results, ending August 3rd, on the 4th of September in pre-market hours showing a stable performance in the quarter despite weakness across the industry amid a weak consumer sentiment. While Q2 financials came in above the expected level, the market reacted very negatively with a -17% stock decline due to JILL’s lowered FY2024 guidance.
In my previous article on the stock, “J.Jill: Improved Profitability With Fewer Stores“, I initiated JILL at a Buy rating as the company’s store network optimization had resulted in clearly better earnings, creating an attractive valuation. After the article was published on the 7th of December, JILL has now only returned 3% compared to S&P 500’s better return of 20% as a previous equity raise and the lowered guidance have pushed JILL’s stock down considerably.
My Rating History on JILL (Seeking Alpha)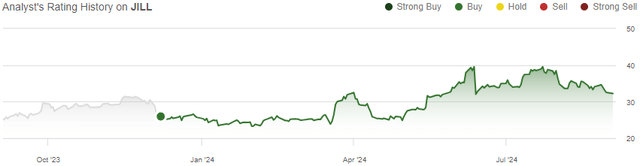
JILL’s Q2 Report: Solid Revenues, Weak Margins In Challenging Industry Backdrop
JILL’s Q2 revenues came in at quite a good level. While the revenues of $155.2 million declined -0.9% year-on-year, adjusting for store count changes and a 53rd week in the prior fiscal 2023 year, comparable sales grew at a positive 1.7% pace, beating Wall Street’s expectations by a small $1.0 million margin.
The comparable revenues were, in my opinion, relatively good as apparel retailers have overall experienced weakness related to a weak Q2 consumer sentiment. For example, Urban Outfitters (URBN) showed a similar 2.0% comparable growth in the same fiscal Q2 period, The Buckle (BKE) has shown immense comparable growth weakness as I’ve previously written including a -6.8% decline in July, and the already previously weak Cato Corporation (CATO) showed a -2% comparable decline. American Eagle Outfitters (AEO) did outpace JILL considerably, with a 4% growth, though.
Apparel inflation in the US has also been incredibly slow throughout JILL’s Q2, ranging from 0.8% in May to just 0.2% in July, further showcasing JILL’s comparable sales’ quite good performance.
On the other hand, JILL’s profitability took a considerable hit in Q2. The gross margin contracted 1.2 percentage points to 70.5%, and as SG&A also increased moderately, adjusted operating income declined by $4.2 million into $24.9 million. The adjusted EPS came in at $1.05, declining $0.10 year-on-year but beating Wall Street’s estimates by $0.14 as the Q2 adjusted EBITDA decline was already guided for with the Q1 report.
Altogether, the Q2 financials came in at a fine level. While revenues were quite strong considering the industry backdrop, JILL’s already guided-for weaker profitability was a negative factor. The weaker profitability included non-recurring costs such as a communicated $0.5 million SG&A increase related to OMS (Order Management System) project implementation, the fiscal year’s shift, and higher freight costs due to the situation in the Red Sea, but the income decline was still quite sharp compared to JILL’s stable revenues.
The Lowered FY2024 Guidance Disappointed The Market
While the Q2 results themselves were above Wall Street’s expectations, the lowered guidance disappointed the market – after raising the FY2024 guidance with the Q1 report, JILL now reconsidered the outlook with a lowering in Q2 due to the uncertain industry backdrop.
JILL now expects FY2024 sales to grow just 0-1% compared to a 1-3% growth range previously. Adjusted EBITDA is now expected to fall -4% to -9%, down from JILL’s previous -1% to -3% decline expectation. Excluding the 53rd week in fiscal 2023 and the OMS project’s temporary SG&A, the new range reflects healthy sales growth of 2-3% and a small AEBITDA hiccup of -1% to -6%.
For Q3, sales are expected to be down -1% to up 2%, and for AEBITDA to be $23.0-27.0 million compared to $28.3 million in Q3/FY2023, expecting quite a similar year-on-year performance as JILL reported in Q2 with slightly better mid-point revenue growth. The company has seen especially weakening traffic trends from July forward, as told in the Q2 earnings call, causing the lowered guidance ranges and weaker-than-expected Q3.
I don’t believe that the lowered guidance is a sign of structural deterioration in JILL’s business; the industry has very apparently suffered from a weak consumer sentiment. As I’ve previously written, Urban Outfitters has also seen weakening retail trends from late July forward, leading the competitor to expect growth deceleration in Q3 compared to JILL’s remaining expectation of slight sequential acceleration. As such, the stock’s very large fall seems like an overreaction.
June Share Offering Deleverages Balance Sheet
In June, JILL announced a 1 million share equity raise and an additional 1 million share offering from JILL’s largest shareholder as a public offering, priced at $31.00 per share. The stock also reacted very strongly to the proposed offering, falling -19% on the 13th of July.
The proceeds were primarily used to pay down JILL’s interest-bearing debt, and after Q2, approximately $73.2 million of interest-bearing debt remains on JILL’s balance sheet. I believe that the equity raise was quite unnecessary, as the company’s leverage wasn’t too high even before the recent paydowns. The transactions did still stabilize JILL’s financing in a good way, even though I believe the equity raise to have been nonessential.
JILL’s Valuation Remains Cheap
As JILL’s interest expenses have mixed lease-related interest expenses, I believe that estimating levered cash flows is more representative of JILL than my prior method of including leases as debt. As such, I updated my discounted cash flow [DCF] model to not subtract debt from the fair value estimate, but for the model to now subtract interest expenses from the cash flow estimates. With $3.7 million in Q2 interest expenses, I estimate $14.9 million in annualized interest cash flows.
Otherwise, I have kept the model quite stable overall. I now estimate low 0.5% revenue growth for FY2024 due to the weak guidance, but still constant 2% growth after the year. I have adjusted the EBIT margin estimate slightly downwards into a sustained 13.0% level compared to a 13.4% estimate previously due to the weaker guided FY2024 profitability.
Excluding the changes to my model regarding interest expenses, JILL’s cash flow conversion should still stand good over the long term.
DCF Model (Author’s Calculation)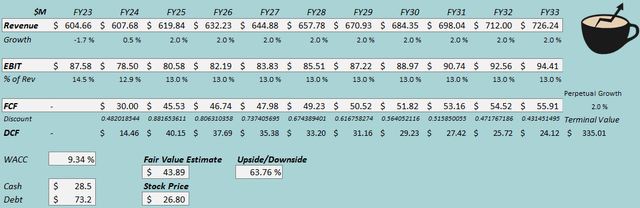
The estimates put JILL’s fair value estimate at $43.89, 64% above the stock price at the time of writing – I believe that the stock remains an attractive investment as the stock provides a stable and good cash flow yield. With the FY2025 cash flow estimate and the share price of $26.80 the cash flow yield stands at nearly 11% for the year combined with stable expected 2% growth going forward.
CAPM
A weighted average cost of capital of 9.34% is used in the DCF model. The used WACC is derived from a capital asset pricing model:
CAPM (Author’s Calculation)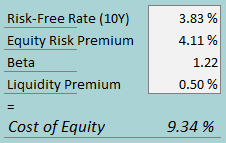
As I now estimate levered cash flows for JILL, I only estimate the cost of equity for the cost of capital. To estimate the cost of equity, I use the 10-year bond yield of 3.83% as the risk-free rate. The equity risk premium of 4.11% is Professor Aswath Damodaran’s estimate for the US, updated in July. For the beta, I now use Aswath Damodaran’s estimates – with the average of the general retail beta of 1.25 and the apparel industry beta of 1.19, the new beta estimate stands at 1.22. With a liquidity premium of 0.5%, the cost of equity stands 9.34%.
Takeaway
JILL’s Q2 financials came in slightly above expectations as revenues stayed resilient amid weak consumer spending and margins declined less than the market expected. While the Q2 financials were fine, the market in my opinion overreacted to a slightly lowered FY2024 outlook as consumer spending in the industry has remained weak. In my opinion, the stock remains undervalued, and as such, I remain with a Buy rating for J.Jill.
Credit: Source link