
SweetBunFactory
Introduction
Fanuc Corporation (OTCPK:FANUY) is not a household name with most retail investors. At first sight, it’s a medium-sized company, with a FY2023 annual revenue (ended March 2024) of $5.2 billion and net income of $818 million. It’s home to just short of 9,500 employees and based out of Japan. However, it’s an established leader within industrial robotics and automation founded back in 1958, meaning it’s got a rich history and has survived multiple economic drawbacks. Throughout this article, you will see me referencing their financials in their reported currency, the Japanese Yen (¥), which as of today changes hands at ¥146 to $1.
If we look at the iShares Automation & Robotics ETF, Fanuc shows up as a top ten holding, and the first holding from the industrials sector, compared to other larger holdings originating from information technology or healthcare. This illustrates its ranking in the marketplace. The iShares ETF listed above, is of European origin, trading with a 0.4% expense ratio, but the US-based reader would have to look elsewhere. One alternative, could be the Global X Robotics & Artificial Intelligence Thematic ETF (BOTZ), where Fanuc is also amongst the top ten holdings. This ETF trades with an expense ratio of 0.68% and contains 51 holdings in total. A more diversified ETF, would be the ROBO Global Robotics and Automation Index ETF (ROBO), where Fanuc, again, is amongst the top ten holdings; however, this ETF trades with an expense ratio of 0.9%, which is high, but it does have 90 holdings.
I first heard about the company more than a decade ago when a financial pundit spoke about this robotics company pioneering automation aimed at manufacturing. Then, a couple of years ago, I was visiting an external collaborator in relation to my job, and while walking through their operation, I witnessed a large setup consisting of several automated robots handling a complex set of tasks, while bathed in the Fanuc logo. This caused me to look closer at the company, prompting me to write my first piece covering Fanuc in the summer of 2022.
At the time I concluded that, while Fanuc is an industry leader, the volatility in its financials and performance called for a larger margin of safety, despite trading at a forward price to earnings multiple of just above 20. Given the fact it is an industry leader within a niche that should be highly sought for, that might not be an unreasonable price tag, but I wasn’t comfortable with the margin of safety. Since then, the stock has returned -2.34% compared to the 50.03% of the S&P 500, so that seemed to be the correct call.
Today, I’ll revisit the company, which is no less interesting in these times where words such as AI and automation are thrown around.
Investment Thesis Summary
Reading this article, you will be introduced to a company functioning as a leader in its niche. However, despite its established position, you will observe a company that struggles on a set of key parameters, that help me conclude, that I would rather seek exposure to the company and its niche, via a broad ETF, as to avoid the company-specific risk.
Some of the arguments I focus on include
- Inconsistent revenue growth over an extended observation period, which is not to be expected from a niche leader, especially when that revenue is below par with the industry growth
- Eroding profit margins despite revenue growth, indicating that Fanuc isn’t able to benefit from operating leverage, the concept that increased revenue should assist in expanding margins over time. In fact, the very opposite is observed here, with profit margins having declined significantly over the past decade
- A unattractive outlook for the coming years both in terms of revenue and profits, as the company appears to have stalled amidst having gone through an upcycle from some key customer segments such as automotive. In fact, management is experiencing a halt in the backlog
The observations above, mixed with an unattractive valuation, cause me to conclude, that this isn’t an attractive time to obtain direct exposure to Fanuc. The industry, however, is forecasted to achieve much better growth than the broader economy throughout this decade, so it could be worth obtaining exposure to. There is the option of considering peers, but also the option of considering ETFs than are constructed to focus on robotics and associated industries.
Who Is Fanuc
Fanuc is a Japanese corporation founded in 1958, originally acting as a subsidiary of the more well-known Fujitsu. In 1972, it was spun off into a separate entity. The initial focus was on advanced application within numerical control, otherwise known as CNC (Computer Numerical Control), which is a type of machinery you will often find in industrial production environments where uniform and complex items and parts are mass-produced. This could be components in both metal and other materials, where software guides the machinery in the production process.
A few years later, in 1982, Fanuc reached an agreement with General Motors (GM) to conduct a joint venture, where Fanuc provided the relevant equipment, while GM provided the management capabilities. The purpose of this venture, was to focus on robotics. By 1987, Fanuc established a similar collaboration, this time with General Electric (GE), but with a focus on CNC machinery. Eventually, Fanuc took over the US located facilities, and that is how a global robotics company was born.
Fanuc Company Overview (Fanuc Annual Report 2023)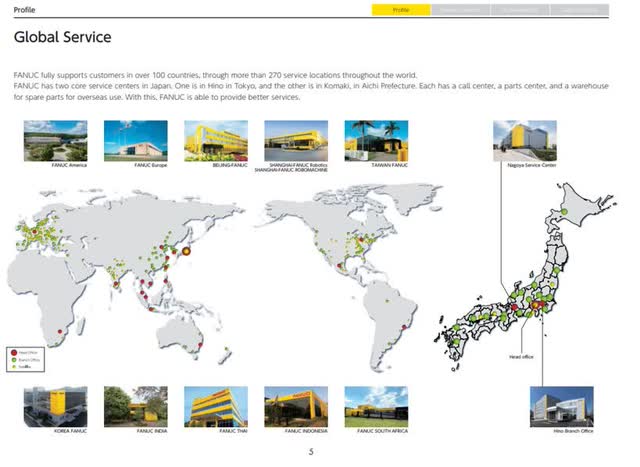
Fanuc has an established footprint on most continents, logically being more mature in its home region, Asia. However, as can be seen in the illustration above, it does exhibit a large presence in the developed part of the world, with more than 270 service locations throughout.
Fanuc carves its business into a number of segments
- FA – basic products incl. CNC machinery and relevant software and components
- Robot – robotic arms aimed at improving quality and process compliance while removing the human element, often due to a safety focus in relation to potentially dangerous environments
- Robomachine – large-scale robot systems for delicate and ultra-precision related tasks
- Service – the service branch of Fanuc
Fanuc Division Overview (Fanuc Annual Report 2023)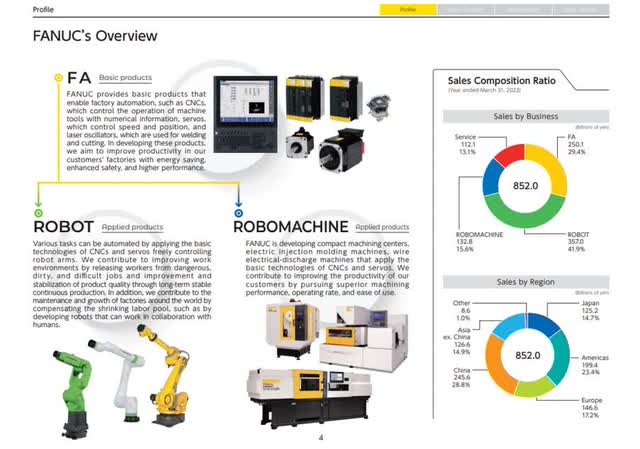
Fanuc has a very diversified revenue base, with 15% in Japan, 23% in the Americas, 17% in Europe, 29% in China and 15% in Asia excluding China. As such, customers are global and include electronics manufacturers, automotive manufacturers – anything related to industrial production where processes can be standardised or carry sufficient value to justify installing robots to improve process quality or remove workers from potentially harmful, dirty or dangerous environments.
A cornerstone of Fanuc’s corporate vision, is to adhere to the philosophy of “reliable, predictable, easy to repair”. This entails that lifetime maintenance is offered on equipment still in operation at the customer. In its home market, Japan, Fanuc conducts close to 90,000 annual repairs alone, of which roughly 10% is conducted on equipment which lifetime has already exceeded 40 years. This is no small feature, especially given that you would normally expect equipment this complicated, to have a much shorter life. This speaks volumes of the quality associated with Fanuc’s product offerings.
Fanuc’s Financial Development
Last I wrote about Fanuc, the FY2021 revenue came in at ¥551 billion with an EBITDA of ¥157.6 billion, compared to FY2023 revenue of ¥852 billion and EBITDA of ¥240 billion. Quite a remarkable growth, and if you observe the illustration below, you will see the company has reached its next plateau for the revenue base, at least if we include the consensus outlook. One important observation here, is that operating leverage hasn’t shown the progress I would expect. In fact, a continued decline in margins is evident, with EBITDA margin expected to stabilise in the years to come. However, stabilising or not, the margins are far away from the best of times a decade ago.
Fanuc Financial Development (Fanuc Financial Reports & MarketScreener.com)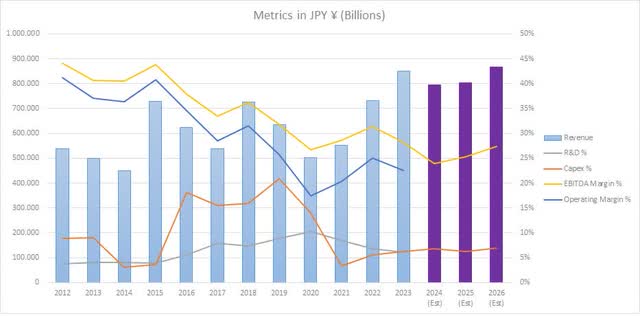
Management cites a number of reasons as to the positive business development overall, with reference to the fact that business is growing. First of all, that Fanuc post the Covid-19 era, has experienced an investment cycle amongst its customers, particularly within automotive, that has made revenue surge. In addition, that strained supply chains have acted as both a pro and a con. The need for customers to adjust their manufacturing footprint and setup has increased demand, allowing higher utilisation in Fanuc manufacturing sites, while the volatility in raw material access has caused Fanuc to struggle with delivering to customers in time. Fanuc’s backlog grew substantially during the post Covid-19 years, but is also beginning to show signs of normalizing, as latest commented on by management during their release of the FY2023 results in April of this year.
The normalization of its backlog, and general uncertainty related to the economic outlook in society at large and also exposure to a very volatile currency, causes management to guide cautiously, which then shows itself in the analyst consensus outlook above.
When asked about their margins, management said the following
“We are not satisfied with the present operating profit margin. Though not announced outside the company, we have set goals internally, and are presently striving to meet these goals. As measures we have adopted, it goes without saying that our products have to become more attractive. In addition, the unit cost is being lowered by producing new models and other means. There are various other activities such as thoroughly cutting back on internal expenses.”
This is also my largest area of concern. Fanuc exhibits a growing revenue over time, however volatile, but the margins have been on the decline for the last decade. From an operational leverage point of view, the idea that increasing revenue should result in increasing net margins, this is very unsatisfactory.
The decrease in margins is, amongst other things, due to the fact that Fanuc’s headcount has increased over the years without having resulted in the same expansion in revenue per employee. Also, CAPEX and associated costs has in some years been large, but that is expected to continue its stable level, same as R&D, which is a very important cornerstone of what makes Fanuc a profitable business, as innovation is key to ensure products are attractive to customers. Same as with other technological products in a growing market, it’s about maintaining the edge on your competitors, and here a large R&D budget is paramount, supported by sufficient manufacturing scale to test and try new solutions on the floor, before putting them on the selves.
According to fortune business insights, the industrial robots marked were valued at $15.6 billion in 2021, projected to grow at CAGR 11.4% to reach $35.68 billion in value by 2029. That’s a significant growth opportunity, well ahead of the global GDP growth. The Asia pacific, including Japan, China and India, is expected to be hosted to most of that growth, being well in line with Fanuc’s existing geographical footprint in terms of revenue distribution. The report sights Fanuc as one of the key companies to be part of this growth.
Given how this marketplace is expected to expand towards the end of the decade, I’m not too thrilled to observe that Fanuc struggles with expanding margins in a time of expanding the topline. It’s important to make the most of a favourable situation, and Fanuc somewhat struggles with this. In addition, while Fanuc is what I would call a project-based organization, meaning that revenue will be volatile, I would expect a stronger uptrend given how the overall market is expanding.
The volatility in its performance can also be illustrated by observing the EPS and ROIC developments, respectively.
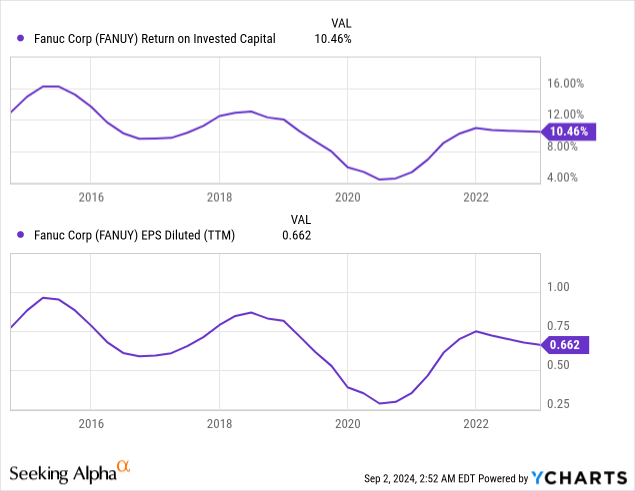
When I prowl for companies to invest in, the return on invested capital is one of my preferred metrics, as I believe it’s a key parameter for long-term value creation in a company. This one metric, I believe, tells one of the most important tales about company management, since it gives a perspective into how efficient management is in pushing capital into profitable ventures. In this instance, Fanuc has a satisfactory ROIC mostly staying above 10%, but also being rather volatile in nature due to investment cycles, and company performance.
My last observation is concerning the balance sheet. Fanuc has what I would call a pristine balance sheet, as it’s entirely self-reliant, with zero debt and roughly $3.6 billion of cash in the bank. Fanuc does this, while pushing a large chunk of its cash back to shareholders in form of dividends, which for better parts of the last decade has been in form of a 60% fixed payout ratio. Due to the volatility in operating income, this means the dividend is volatile as well. This dividend is provided in bi-annual instalments. Concerning the dividend, one should also take the highly volatile Japanese yen into perspective, which has been moving in the direction of a significantly weaker yen in the past years.
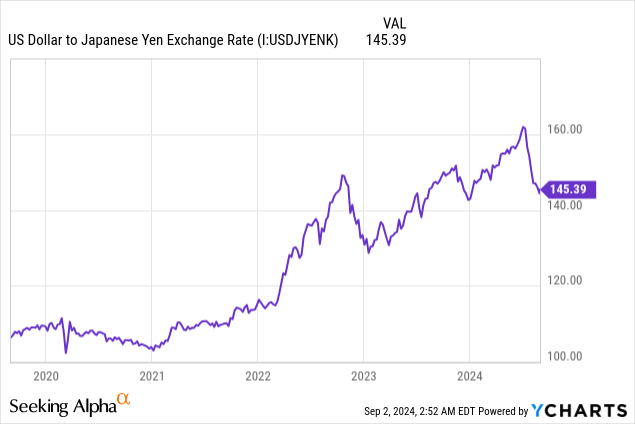
A factor that management also highlights as a parameter of uncertainty when providing forward guidance. Fanuc, as already mentioned, has a very diversified revenue base, with a significant part of its cost base in the local currency.
Japan is a country with limited access to natural resources, so Fanuc will have to procure most of the raw materials in foreign resources, making those costs more expensive in a scenario of a weaker currency. However, with a diversified revenue and profit base, it’s also able to capitalize on the situation to some extent in the case of foreign profits. As any other large organisation, Fanuc of course also hedges costs and revenue to limit impacts of exchange rates.
To summarize, Fanuc is profitable, operates with a clean balance sheet in a strongly growing market while commanding a leading position. All observations, which would normally cause me to be enthusiastic. However, management is struggling with securing operational leverage, meaning that profits struggle with growing in tandem with the expanding revenue base, in fact, profits margins have been more or less consistently declining over the past decade. This does not provide a promising outlook and investors can understandably doubt if management can improve the situation
Valuation & Closing Remarks
Before we get to the valuation, I’d like to point towards the graph below showing how the stock fairs compared to its most recent high. As can be seen, the stock trades just shy of 43% off its most recent high, which was all the way back in 2021. This is a stock, that is out of favour with the market.
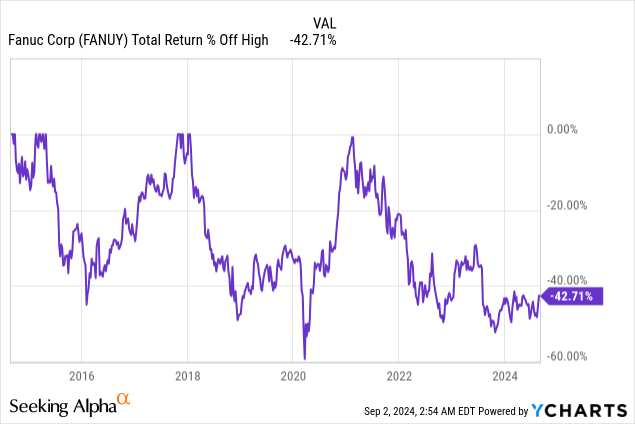
Last I covered the stock, the picture was more or less the same. Back then, profits were expected to improve, and they did, at least from a numerical standpoint. Profits haven’t been higher since 2018, which is great, but that was a result from a much lower revenue base as per the previous perspective on eroding margins.
As per data from MarketScreener, Fanuc is trading with a forward P/E of 29.8 and forward 1-year P/E of 24.8. If you can grow 11% CAGR until the end of this decade, then that’s not an unfair price tag, but the big question here is if Fanuc can achieve that growth given the soft revenue consensus outlook. Today, I would doubt Fanuc’s ability to do so, and even so, I would have concerns related to the profitability in relation to the revenue.
My conclusion is that Fanuc isn’t an appetizing opportunity. If I as an individual investor wanted exposure to this industry, I would look towards potential peers, but more likely, I’d go the route of a broad ETF due to many of these companies also being located geographically in regions that are far away from my every day, meaning that I will more often than not struggle to fully understand governance and corporate culture, which provides an additional layer of risk.
Editor’s Note: This article discusses one or more securities that do not trade on a major U.S. exchange. Please be aware of the risks associated with these stocks.
Credit: Source link