
HJBC
At the end of last year, I set an optimistic price target for Amazon.com, Inc. (NASDAQ:AMZN) (NEOE:AMZN:CA), expecting the shares to hit $220 by the end of 2024 helped by strong consumer spending and major profit margin expansion. So far, the stock has peaked at around $200/share, followed by a general market sell-off driven by increasing unemployment from 4.1% to 4.3% in the US, sending the shares as low as $150, before settling at around $180, where the stock trades today.
On a year-to-date basis, the shares are up 17.5%, and on a trailing twelve-month basis, up roughly 30%.
Yet, if we zoom out, Amazon’s performance has been trailing the other Mag7 companies in performance but not in improving fundamentals.
Amazon entered a new era of efficiency, capitalizing on the investments from the prior decade into its autonomous warehouse network and last-mile delivery, setting its profitability apart from brick-and-mortar retailers and not being a one-trick-pony, with AWS meaningfully contributing to the margin expansion.
Amazon’s business, with a $600 billion revenue run rate, is in a great spot to continue expanding the bottom line, and that’s one of the few reasons why I continuously rate the company as a “Strong Buy,” which has so far proven to be the right call.
Previous Coverage (Seeking Alpha)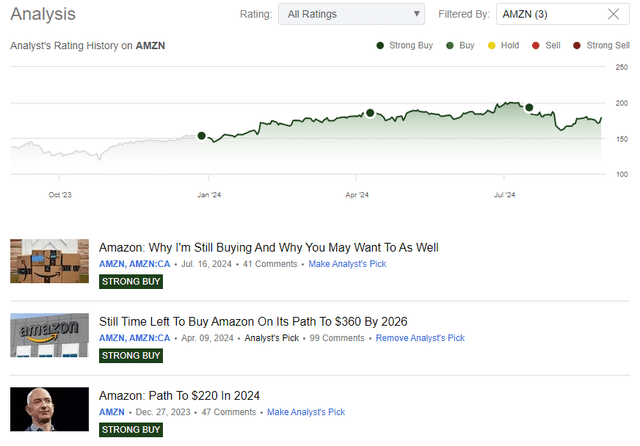
Today, investors can still buy Amazon’s stock at 14.5% off its all-time high. The stock is trading at a relative bargain compared to its historical valuation, and there is no growth slowdown on the horizon.
% of all-time high (Seeking Alpha)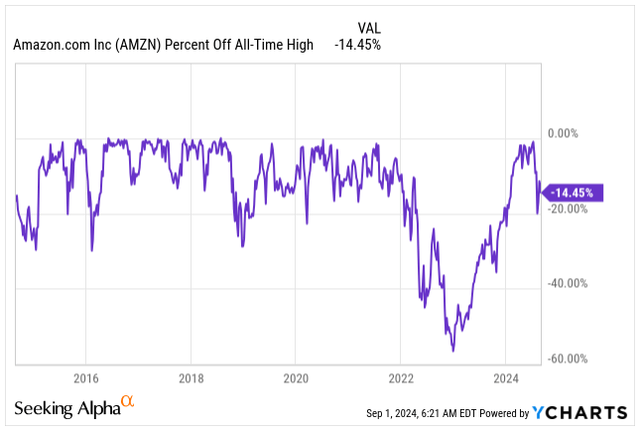
These are just a few reasons why I doubled down on Amazon’s shares during the August market pullback, buying shares at around $155, roughly doubling my position.
Now, Amazon is the single-largest holding in my personal equity portfolio.
Strong Q2 Thanks To Margin Expansion
2024 has so far proven to be a very successful year for Amazon, with the Q2 Net Sales increasing as much as 10% to $148B from a $134.4B year prior.
At the current run rate, Amazon’s business is poised to deliver over $600B in revenue in one year for the first time ever, with analysts estimating that it will continue growing the top line by around 10% annually at least until 2027.
Let that sink in. Amazon is already a $1.8T juggernaut today, and expecting 10% top-line growth is simply superb.
Projected Revenue Growth (Seeking Alpha)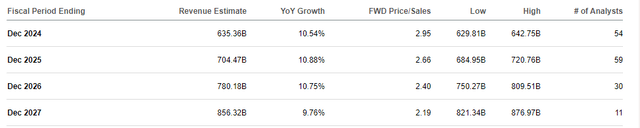
Amazon’s diversified business is firing on all cylinders without any signs of slowing down. In fact, almost all key segments of business have delivered double-digit growth in Q2:
- North America segment sales grew 9% YoY, reaching $90B.
- The international segment grew 7% YoY, negatively impacted by FX, topping $31.7B. On a currency-adjusted basis, the growth was 10% YoY.
- The AWS segment delivered stellar 19% YoY growth, reaching $26.3B. The previous quarter, AWS grew 17%, confirming the acceleration trend in Amazon’s arguably most important business segment.
Naturally, a top line is vitally important to any business; however, for Amazon, the main story revolves around margin expansion and converting the gargantuan revenue base into meaningful earnings.
In Q2, this narrative was confirmed, with Operating Income reaching $14.7B, virtually doubling from the prior year. AWS remains the primary profit driver, representing 69.8% of Amazon’s operating income, despite the business being only 16.5% of the total revenue.
However, it’s not all just AWS; even though the company’s valuation is today heavily intertwined and based on particularly this profit-driving segment, Amazon’s roughly $500B retail business is still a vital part.
Now, let’s compare Amazon’s profitability to that of other major US retailers, such as Costco (COST), Walmart (WMT), and Target (TGT).
The picture that emerges automatically shows Amazon’s leading edge over the other, predominantly brick-and-mortar retailers, with Amazon’s 9.9% operating margin significantly ahead of the pack.
Operating Margin Comparison (Seeking Alpha)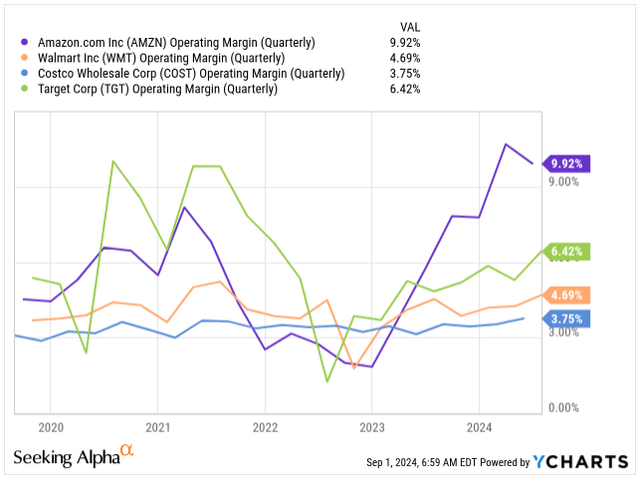
Of course, comparing Amazon’s operating margins to those of other retailers is not necessarily a like-for-like comparison, mainly thanks to AWS’s software-like 40% operating margin; however, over the long term, I am expecting Amazon’s retail business to achieve superior profit margins, around 6% to 8% driven by its unique e-commerce model, which is more efficient and automated than store-based, with AWS as a cherry on top.
Suppose we assume no significant changes in each segment’s weight on total revenue. In that case, I assume the North American segment has the potential to expand its Operating Margin to 7.5% by 2027 (meaningfully higher compared to peers), with International still being a drag yet expanding towards 2%.
AWS profitability has been the success story, expanding roughly 10% since 2018, and I expect continuous strength, particularly with AI-enabled applications resulting in larger and longer contracts. Nevertheless, I am cautious in my assessment, expecting its Operating Margin to reach 43% by 2027.
| Year | 2024 | 2025 | 2026 | 2027 |
| Revenue (b$) | $ 635 | $ 704 | $ 780 | $ 856 |
| OM – North America | 5.6% | 6.3% | 7.0% | 7.5% |
| OM – International | 0.1% | 0.5% | 1.0% | 1.7% |
| OM – AWS | 38.0% | 40.0% | 41.5% | 43.0% |
| OM – Combined | 9.9% | 10.8% | 11.5% | 12.2% |
| Operating Income (b$) | $ 62.99 | $ 75.68 | $ 90.00 | $ 104.85 |
*OM = Operating Margin
As per my assessment, Amazon’s efficiency is expected to improve meaningfully in the next few years. I expect a combined Operating Margin to reach as much as 12.2% by 2027, significantly improving the bottom line and driving the P/E valuation, which many consider rich, downwards.
Since Amazon’s AWS is the company’s bread and butter and the main reason why the stock is valued as a tech company rather than a retail one, there is no excuse not to look under the hood of what’s happening in the segment.
To relieve many investors, AWS is finally showing signs of reacceleration:
- Q2 2024: 19% YoY Revenue Growth
- Q1 2024: 17%
- Q4 2023: 13%
- Q3 2023: 12%
As more cloud providers endorse and integrate AI solutions into their cloud applications, large enterprises and governments renew larger contracts, driving accelerated growth and shrugging off fears of Microsoft’s (MSFT) Azure feasting on AWS’s lunch.
To put the market share into perspective, based on the data from Q2 2024:
- AWS: 32%
- Microsoft Azure: 23%
- Google Cloud: 11%
The Cloud Market is expected to grow 22% this year, reaching $79B. This figure is particularly important because, as we gauge it against Amazon’s 19% YoY growth, we see that Amazon is relatively well retaining its market dominance, growing in a similar fashion as the market as a whole.
The cloud market overall benefits from secular growth due to industries increasingly adopting cloud technologies as part of their digital transformation initiatives. We can see similar growth across its peers, with Google’s (GOOGL) Cloud growing 29% in Q2 and Microsoft’s Azure growing 19%.
The one area of critique remains the reckless CAPEX spending aimed at building state-of-the-art data centers with NVIDIA’s (NVDA) GPUs as part of a wider industry switch to offering AI solutions to its customers. Amazon’s CAPEX this year is expected to precede the 2023 figure of $48.4B.
I expect AI to be a major enabler for Amazon to drive meaningful growth, with billions of dollars of yet untapped potential, as we witness major productivity transformation over the next few years. Perhaps short-term AI appears to be overhyped shorter, but long-term potential is underhyped.
By buying Amazon’s stock, investors get retail business with expanding profitability, industry-leading cloud platform AWS, and, more recently, Amazon’s successful advertising segment, which is now starting to meaningfully contribute to the company’s success with $12.7B in sales, in Q2 growing 20% YoY.
Altogether, Amazon is in a great position to keep rewarding shareholders, and the company now expects Q3 Net Sales to reach $154B to $158.5B, implying a growth of around 11% at the high end of the range.
Operating Income is expected to increase continuously, to around $11.5B to 15B, compared to $11.2B in Q3 2023.
The outlook is somewhat cautious, with the ongoing uncertainty around consumer strength in the US. We are seeing cracks at the lower end of the income spectrum, while the middle and upper classes continue to spend. Yet, as long as the US economy does not hit a recession in H2 2024, Amazon is set to deliver better-than-expected results, in my opinion.
Valuation
178x.
That’s the number of times you would multiply your initial investment if you invested in Amazon on its IPO day.
That’s $10,000 turning into $1,780,000 in a span of less than 30 years. Compounding at its finest if you ask me.
Of course, these are just hard figures, and personally, I do not know a single investor who scooped up Amazon’s shares prior to the turn of the millennium. However, I know many people who have never bought Amazon, even in the last 5-10 years, claiming the company’s rich valuation is restrictive, skipping on a major success story and gains alike.
If you look at Amazon’s valuation through the lens of P/E, you will see that the company is by no means cheap. The company is trading at a blended P/E ratio of 43.5x and has traded on average at 170x its earnings in the last 15 years alone due to a lack of management focus on converting revenue into earnings, prioritizing top-line growth instead.
That’s a rich valuation, but is this the right way to look at it?
Inherently, P/E valuation does not capture the cash generation potential of companies that do not focus on bottom-line expansion. That’s why I argue this metric is simply wrong to use in the case of businesses like Amazon.
The narrative has shifted in the last 24 months, prioritizing the bottom line, which is the reason why the stock is 75% below its 15Y average, however, still I prefer to use Price to Operating Cash Flow to fully capture Amazon’s potential.
The stock is currently priced at 17.54x its Blended P/OCF, 30% below its 15Y average of 25.05x.
Since 2011, Amazon became a cash-generating machine, delivering a 27.8% annual OCF growth, and the trend is expected to carry on:
- 2024: OCF of $11.23E, YoY growth of 39%.
- 2025: OCF of $13.31E, YoY growth of 19%.
- 2026: OCF of $16.70E, YoY growth of 26%.
Beyond 2026, it’s inherently risky to project what will happen, but expecting 15% – 20% annual OCF growth is reasonable, without the fear that Amazon is being repriced downwards as a result of slowing growth in the future.
In my perspective, there is no reason why Amazon’s valuation should be depressed as it is today with the US economy strong, supported by strong consumer spending and AWS benefiting from enterprise investment modernizing their workload with AI-enabled solutions to drive further growth.
Expecting around 40-45% annual ROR from over the next three years is absolutely feasible, and Amazon’s depressed valuation is one of the reasons why the stock is my number one holding right now.
AMZN Valuation (FAST Graphs)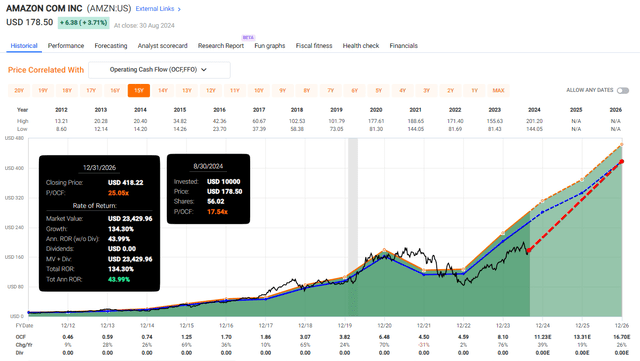
Investor’s Takeaway
In summary, Amazon presents one of the mega-cap-value-buys money can buy today amidst the efficiency era, with the company’s valuation depressed.
The US economy continues to hold up well, with consumer spending intact, at least in the middle and upper class, with Amazon’s major enterprise spending on cloud solutions to modernize workflows.
I took the opportunity during the August market slump, doubling down on my Amazon position at around $155/share, expecting up to 45% annual ROR over the next few years.
Credit: Source link