
Sundry Photography
Nvidia…heard of it, LOL?
I’ll let the many other analysts on this platform provide the deep-dive fundamental analysis on Nvidia Corporation (NVDA) following its earnings release Wednesday night. I’m a chartist and portfolio manager, so to me the question is less about the reasons for what is happening, and more about how to earn a return or avoid loss based on what is happening.
And NVDA is such a market darling and such a big element in so many ETFs, and influences the broad stock market’s mood to such a degree, I think even folks like me, who tend not to be big followers of the nuances of companies like this, need to have some way to evaluate it. To ignore NVDA would be like ignoring the need to wear shoes to go out for a run. OK, I guess some folks run barefoot, but hopefully the point is clear. I don’t have to like the excessive coverage of the Fed, NVDA, and the 10-year bond (US10Y). But I do have to monitor it, simply because these things move prices, and I want to avoid collateral damage to my portfolio.
But there’s a key point relating to NVDA and the existence of ETFs such as the GraniteShares 2x Long NVDA Daily ETF (NASDAQ:NVDL). I have experimented with this one in small size, and over short time frames, as any investor should do before putting “real money” into something that is an innovative but highly volatile form of investing.
NVDL, NVDS, call options and put options
Those are 4 ways to include a non-traditional NVDA position, and there are other ETFs from other issuers, too. Currently, I have only a small position in the Investment Managers Series Trust II — Tradr 1.5X Short NVDA Daily ETF (NVDS), which is a long name for a simple concept: for every $1.00 NVDA loses, NVDS gains about $1.50. This is calculated daily, and so investors should be aware that the math can potentially work against you with levered ETFs. But I have a comfort level with them after years of using options, and now these ETFs.
Still, the key point here is not this product or that. But NVDL is instructive. It debuted in December 2022, less than 2 years ago, and has accumulated $5.75 billion in assets. However, as a stronger testament to my key point, that NVDA is now everyone’s to follow, the average dollar volume on NVDL is about $180 million a day. So like it or not investors, there is a lot of positioning, tactical and otherwise, going on around NVDA’s stock. And it is not people chasing the company’s 0.03% annual dividend yield!
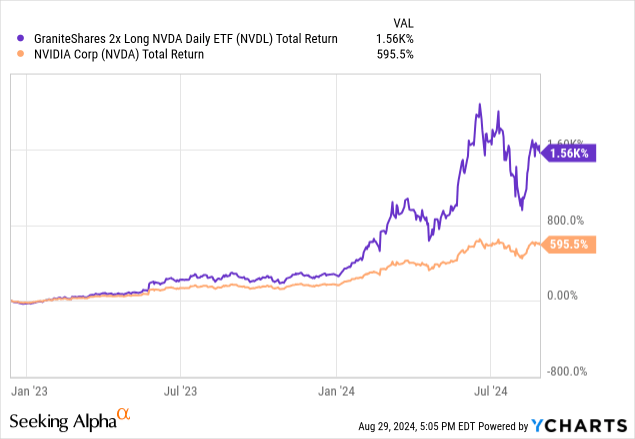
The price chart above shows that 2x leverage can beget more than 2x return. NVDL is well above double NVDA’s return since NVDL’s inception. And while my position on NVDA is not a traditional buy, sell or hold (since I use NVDL and other forms of NVDA-related securities as a surrogate for adding “risk on” exposure or “risk off” exposure, given how the rest of my portfolio is positioned), it helps to know that at times when my dividend-driven stock portfolio doesn’t stand a chance of keeping up with furious periods of Nasdaq gains, just a dollop of NVDL can close some performance gap, with a relatively low capital outlay. Like options, just not as levered, and more capital has to be spent to invest in a 2x ETF to get the same impact as a call option.
No, this is not “trading” to me. It is a form of balancing my otherwise “boring” dividend stock, ETF and T-bill portfolio.
Just because someone incorporates leveraged or inverse ETFs or options into their investment framework, it does NOT mean that they are speculating or trading, and not investing. Guess what the biggest S&P 500 index ETFs and index mutual funds do every single day? Make trades to adjust their weightings back to the target index.
Same with the way I and many other investors approach vehicles like NVDL and the other alternative approaches mentioned above. Because every single position in my portfolio is part of a bigger puzzle. Sometimes, I think investors, especially newer ones, underestimate the value of tactically adjusting positions as well as overall market exposure.
Index funds do it because their mandate is to match the target index, S&P 500 or whatever. Macro hedge funds do it in order to re-adjust their total portfolio’s risk and reward potential to whatever their target market exposure is. And Rob Isbitts does it to capture more dividend income, avoid big draw-downs in the stocks he owns, and to provide some additional upside and protective features to his family’s investment portfolios.
I’ll review my thoughts on NVDA’s technical position, and discuss NVDL in more detail below. First, a quick review for some perspective:
My investment priorities are:
-
Dividend income
-
Avoiding big price dips along the way
-
Creating a total return as consistently, on as steady a path, as possible.
It isn’t everyone’s approach, but has been mine since the 1990s. And it’s kept me out of trouble. But I’ve also missed out on some of the biggest winners in modern market history. That’s my “cost” for adhering to the above rules.
That said, I’ve increasingly found ways to earn my “fair share” of the upside by incorporating 2 key elements that were not part of my investment process 20 years ago, but are a central driver now:
-
Tactical rotation among positions instead of “buy and hold”
-
Strategic use of options as a low-cost, low-risk surrogate for committing big chunks of hard-earned capital to the sexy-but-dangerous parts of the equity market.
And that brings me to NVDA, which announced earnings last night. Or was it the Super Bowl? It is difficult to tell these days. Because the hype around the stock and its quarterly results make me think that in parts of my old stomping ground in NYC, there are sports bars packed with people at 4:20 ET on days like yesterday when NVDA reported. And in this case, that time had nothing to do with smoking weed!
NVDA: Chart View
4-hour chart: See that circled section at the bottom? That confirms that short-term, NVDA is about 1-2 down days away from potentially falling through to at least noticeably lower levels. Will it happen? Don’t know. This is about sizing up the odds.
TC2000 (SungardenInvestment.com)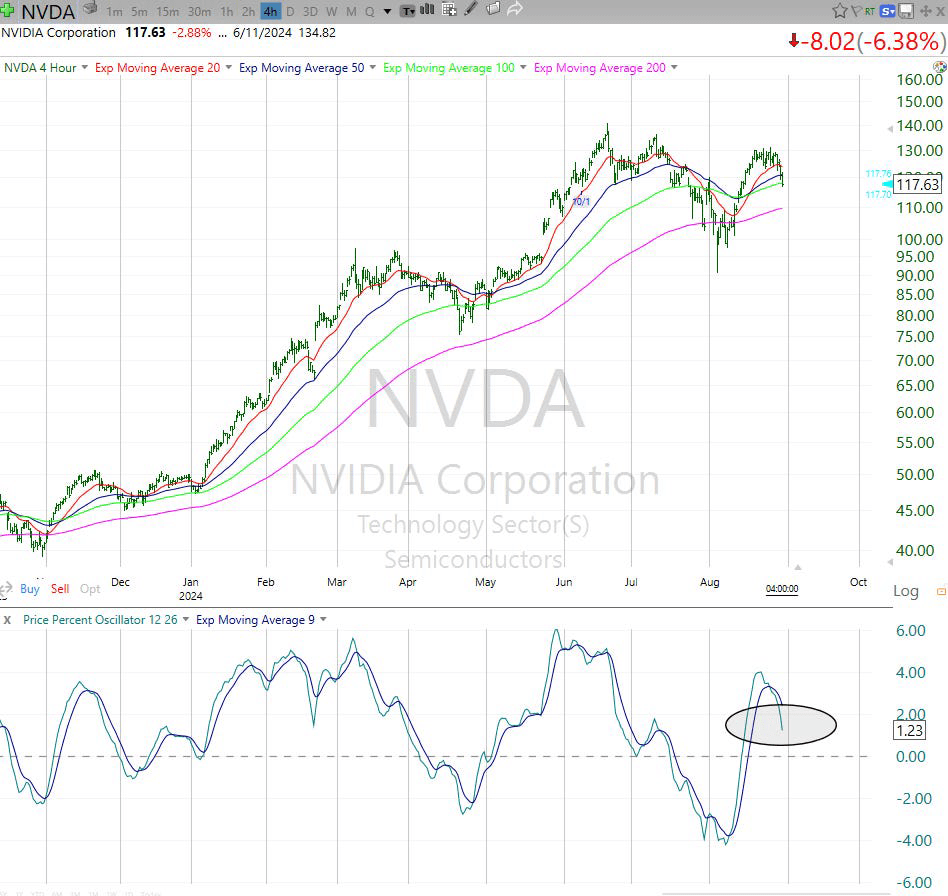
Daily chart: Now THAT is a thing of beauty! I’ve dabbled in trading positions in NVDA, including call and put option purchases back when that was affordable. The stock’s volatility is too high now to traffic too heavily in options.
TC2000 (SungardenInvestment.com)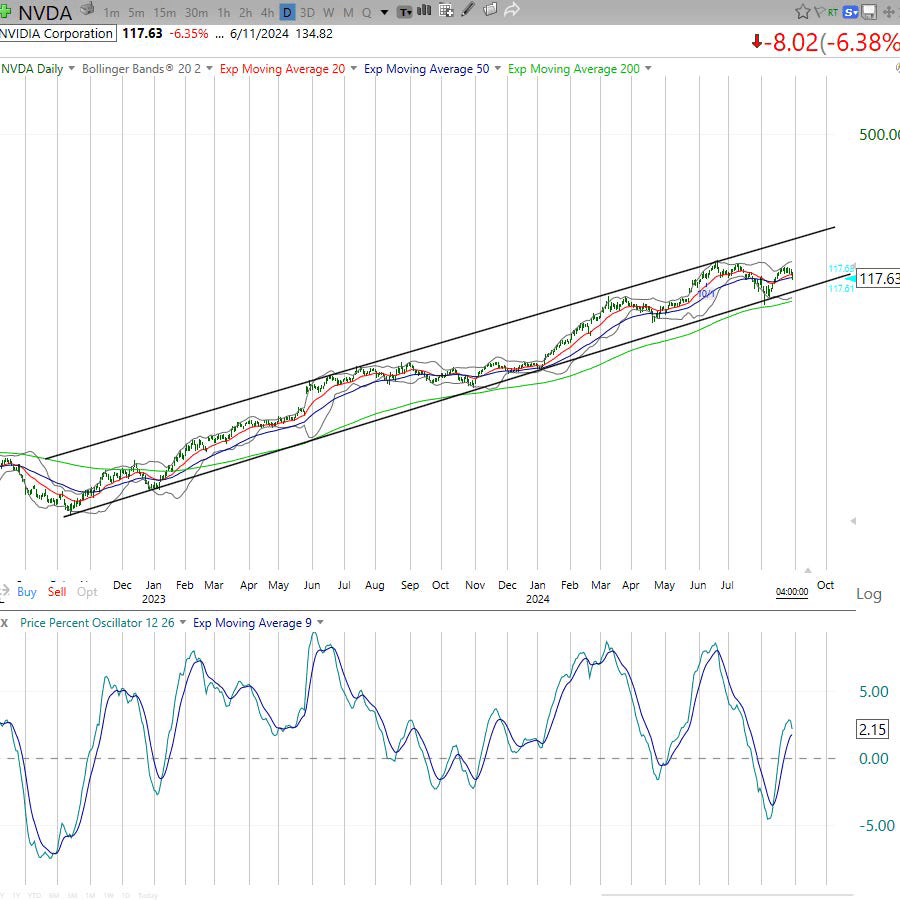
Weekly chart: This one looks intact on top. NVDA would have to fall into the 90s to really start to risk a long-term unraveling. Not that it couldn’t happen this autumn. But there’s not enough chart evidence here yet, not even close.
However, there’s a potential “canary in the coal mine” at the bottom of the chart, the momentum indicator I use. What I circled there, translated from chart geek language to English, is this: “I fell, I thought I was getting up, but now I’m not so sure if I can stand up all the way straight.”
TC2000 (SungardenInvestment.com)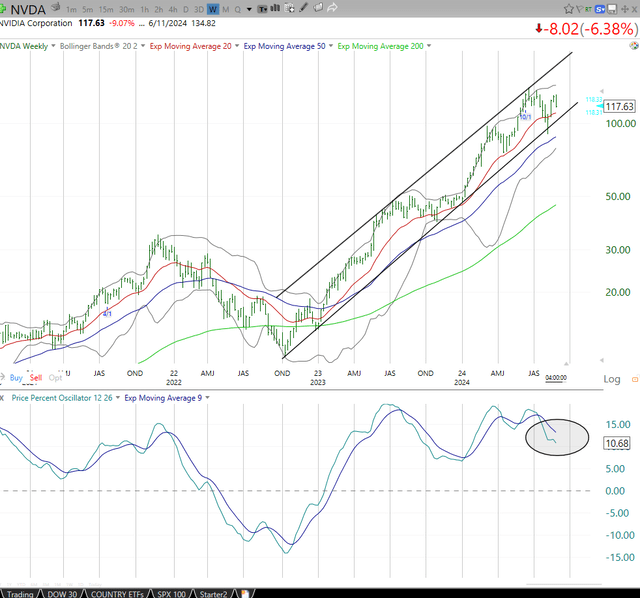
That’s the indicator I will be watching most closely in the coming 3–6 weeks and beyond. Because again, NVDA is a part of every equity investor’s life now, whether they own it or not. It is a surrogate for “the market will be OK.” And while Thursday’s 6% drop is yet another bump in the road that could end up being nothing, each time it happens, the habit I have drilled into my investment process for decades is this: take a look, see if it checks the boxes, and keep tracking it.
Risks
If NVDA breaks down hard, there’s a good chance that most of the growth segment of the global stock market goes with it. Then, suddenly, it is not an NVDA problem. It’s an equity market problem.
Even in 2000 when the dot-com bubble burst, there were some sectors that held up for a year or so while tech cratered. Ultimately, they all fell, with the Nasdaq 100 (NDX) leading the charge down, to the tune of an 83% decline. It fell more than 30% for 3 years straight!
I don’t have a crystal ball to predict what this cycle will bring. But I do know I am tracking Nvidia stock closely because I think we all need to, for sentiment purposes at least.
Please review the risks of leveraged ETFs as explained in the linked SEC bulletin before placing any trades in NVDL. These risks include extreme volatility, time and volatility decay, and the real possibility of losing all of your investment. The normal risks can be exaggerated with single-stock ETFs such as NVDL. Only experienced traders who fully understand the risks should trade them. This article further explains the important risks of such ETFs with examples.
Conclusions
Many of my articles, including several coming up soon, are focused solely on how I am positioning a security in my portfolio or avoiding it. This article is more about the nature of using ETFs like NVDL and other single-stock ETFs to try to use my capital efficiently.
The advent of leveraged and inverse ETFs that allow investors to go up to 3x long and 4x short NVDA is a game changer. These vehicles are not for everyone, and certainly have traders in mind. But I do think this is a part of modern investment markets that investors need to better understand. This is even if they won’t touch a leveraged long ETF, leveraged short ETF, call option or put option with a proverbial 10-foot pole.
Credit: Source link