Digital Vision./DigitalVision via Getty Images
Chinese stocks are under pressure, as the region has suffered from approximately $12 billion in net inflows since the start of June. As such, I decided to assess the iShares China Large-Cap ETF’s (NYSEARCA:FXI) prospects due to its systematic linkage to China’s broader financial landscape.
Furthermore, in an unanticipated turn of events, the FXI ETF has underperformed the MSCI World ETF (URTH) in the past three years. Therefore, the question becomes: Does the FXI ETF present a “buy the dip” opportunity, or are Chinese large-cap stocks a no-go zone?
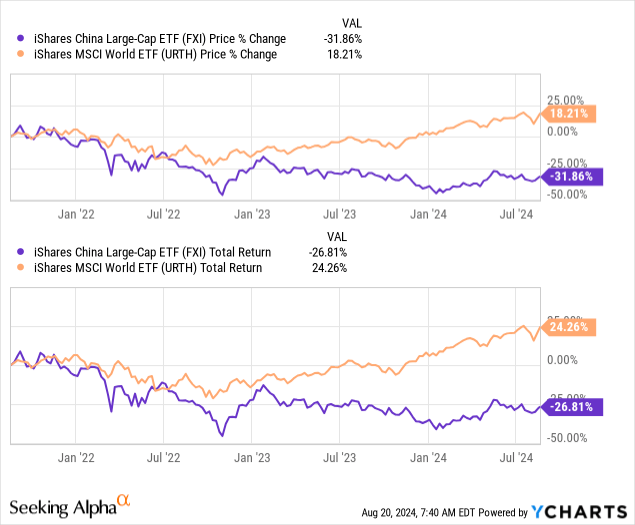
To address the central question, I embarked on a systematic analysis. Moreover, I phased in a few idiosyncrasies to ensure complete alignment.
Herewith are my latest thoughts about the iShares China Large-Cap ETF.
What Is FXI ETF?
The iShares China Large-Cap ETF is a market-cap-weighted ETF that invests in the Hong Kong Stock Exchange’s top 50 constituents. The ETF generally produces results similar to its benchmark, the FTSE China 50 Index. However, occasional tracking errors might occur due to the vehicle’s representative sampling techniques, expenses, and securities lending activities.
Sidenote: In my experience, tracking errors can arise through illiquidity, differences in cross-country settlement times, and extensive use of American Depository Receipts instead of the underlying instruments.
Tracking Error (Seeking Alpha)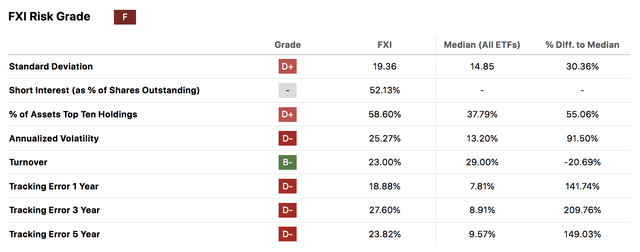
Furthermore, a glance at FXI’s current sectoral exposure illustrates a tilt toward consumer discretionary and financial services stocks, suggesting it has cyclical attributes.
Sector Composition (Seeking Alpha)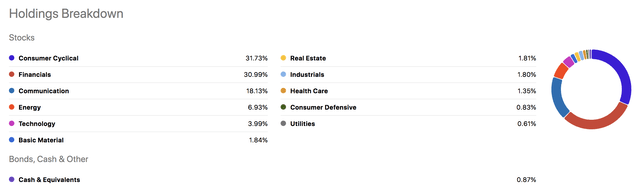
FXI ETF’s constituent composition shows that the vehicle generally limits its concentration risk to below 10% per constituent. Although a market-cap-weighted ETF, it tries to reduce its concentration risk by setting exposure boundaries.
Another side note: You’ll notice that the ETF currently has 56 constituents. In my experience, an ETF will use buffering and packeting to smooth the vehicle’s rebalancing process and avoid excessive turnover concurrently.
Constituents (Seeking Alpha)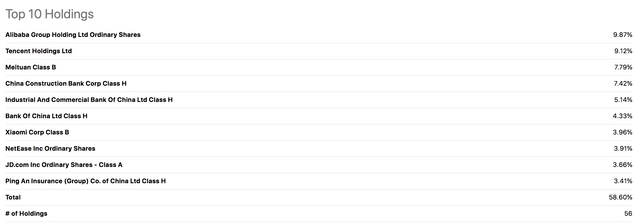
Headwinds
Investors Losing Faith In Chinese Stocks
As mentioned in the introduction, investor outflows from China have been severe, totaling a reported $12 billion since June. To take it a notch further, BNN Bloomberg reported that China might face its first annualized net outflow, which, in turn, led to local authorities suspending regional market data releases.
Something seems fishy here, right?
China Investor Outflows (Bloomberg)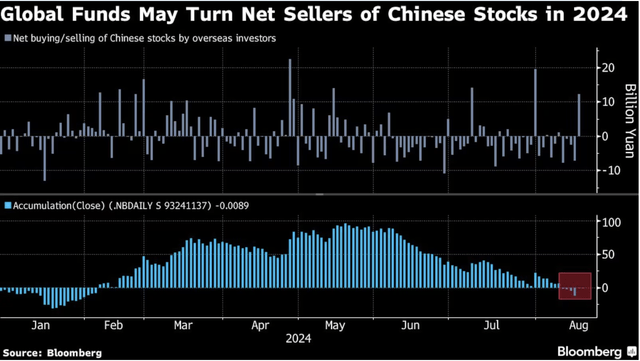
How will China’s stock outflows impact the FXI ETF?
Some might consider my opinion oversimplified, but I believe in parsimony.
Despite hosting a few quality companies (or what I consider quality companies), data transparency concerns, political influence, and economic turmoil (discussed later) might lead to a sell-off of Chinese equities. Unfortunately, large-cap stocks might feel the pinch due to their representative liquidity and inclusion in structured vehicles like the FXI ETF.
The abovementioned is a market-based observation. However, let’s move into a fundamental discussion to see whether my assumption is valid.
Real Economic Factors
Salient Features
While financial markets and economic variables can display weak correlations, long-term stock total returns usually correlate with a region’s real economic performance, at least from a systematic vantage point.
Aside: In my experience, correlations between GDP growth and stock returns will be low when a concurrent correlation is tested; I wish researchers would use implied GDP instead of realized GDP.
The next diagram shows a time series of some of China’s core economic variables; a discussion follows.
| Metric | Value In 2024 | Value In 2014 |
| Annual Real GDP Growth Forecast | 4.7% p/a until 2029 | 7.39% |
| Capital Flows | Questionable Outlook | Positive Outlook |
| Government Debt/GDP | 83.6% | 40% |
| Current Account/GDP | 1.5% | 2.1% |
Sources: Statista, Trading Economics
In isolation, China’s real GDP forecast is commendable. However, its implied growth has slowed in the past ten years, likely due to its economy maturing and political headwinds.
Furthermore, China’s debt-to-GDP has doubled in the past decade and has exceeded the 80% threshold, which is considered worrisome for an emerging market. Additionally, my outlook on a related variable, China’s capital flows, is negative based on its recent net equity outflows and the Chinese Communist Party’s weakening ties with the Western world.
Aside from its decelerating long-term trajectory, China has interim economic challenges.
The following diagram illustrates the country’s interim risk factors by summarizing slowing short-term GDP growth, rising unemployment, waning consumer confidence, and sluggish retail sales.
Short-term economic indicators (Trading Economics)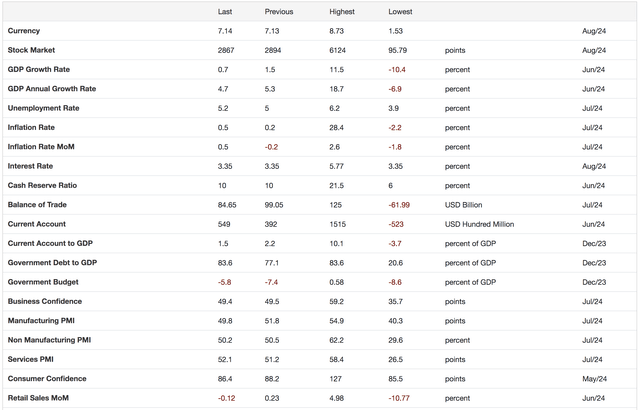
Salient data points show that China’s economy faces noteworthy challenges, which have rippled through its stock market, leading to FXI ETF’s demise.
Unfortunately, I cannot justify a rebound of FXI ETF as its portfolio is exposed to highly cyclical sectors such as financial services firms, consumer cyclical companies, and real estate. These sectors comprise more than 60% of the vehicle’s portfolio, which I deem unfavorable for now.
Potential Banking Crisis
Approximately 40 Chinese banks were recently hit with bad debts, resulting in a TARP-esque mission in which larger institutions (some state-owned) absorbed toxic assets.
Reports suggest that 40 Chinese banks were taken over in the first six months of 2024. The root cause was the real estate sector, which felt the pinch of lower collections and receding collateral values. Although a banking crisis hasn’t occurred, the event suggests that broad-based systematic risk is high.
The following chart provides an exposition of China’s banking structure.
China’s Banking Structure (Journal of Economic Geography)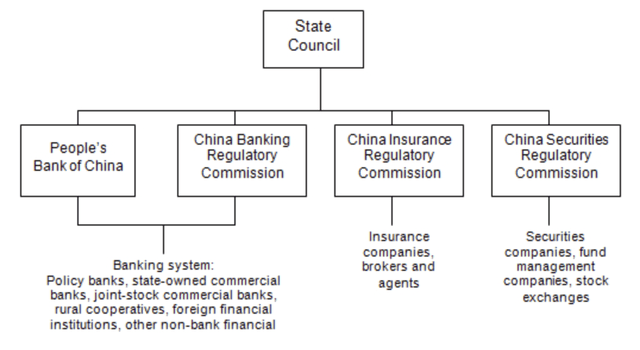
Approximately 30% of the FXI ETF’s portfolio comprises financial sector firms, illustrating its exposure to China’s systematic risk. Additionally, peripheral and knock-on effects usually occur when the banking system is under pressure, meaning FIX’s other sectors might feel the pinch in due course.
A few examples of potential peripherals.
- Higher borrowing costs for corporate entities.
- Lower consumer confidence.
- Reduced financial and tangible asset values.
- A general “fight or flight” response, resulting in volatile financial markets.
FXI’s Portfolio Attributes
Let’s start this section by examining the FXI ETF’s valuation metrics.
FXI ETF’s portfolio has a price-to-earnings ratio of 11.3x (P/E), nearly half of the SPY ETF’s (SPY) P/E of 26.93x. Although many might consider the ETF’s P/E indicative of relative value, FIX ETF has a beta coefficient of merely 0.28x, suggesting it is a low-volatility ETF. Therefore, a lower P/E is likely justified.
iShares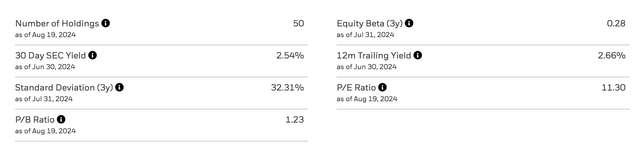
I couldn’t find a delineation of the portfolio’s growth prospects through iShares. Thus, I collected data from Seeking Alpha to contextualize FXI’s growth trajectory.
The following diagram shows that some of FXI’s constituents have experienced illustrious growth. However, other companies have decelerated, revealing the disparity in the portfolio’s fundamental performance.
| Stock | Revenue CAGR | Net Income CAGR |
| Alibaba (BABA) | 7.3% | -22.05% |
| Tencent (OTCPK:TCEHY) | 5.78% | -6.72% |
| Meituan Class B (OTCPK:MPNGF) | 29.15% | 1.23x |
| China Construction Bank Corp (OTCPK:CICHY) | 2.96% | 6.56% |
| Industrial and Commercial Bank of China (OTCPK:IDCBF) | 2.56% | 4.46% |
| Bank of China Class H (OTCPK:BACHF) | 3.56% | 5.82% |
| Xiaomi Corporation (OTCPK:XIACF) | 1.68% | -12.42% |
| NetEase Inc (NTES) | 10.93% | 32.75% |
| JD.com Inc (JD) | 8.91% | -5.02% |
| Ping An Insurance (OTCPK:PNGAY) | -12.37% | -16.49% |
Source: Seeking Alpha (3-year CAGRs used)
By examining the ETF’s valuation and growth metrics, I didn’t see enough evidence to conclude that FXI ETF possesses telling future value.
Peer-Based Analysis
I conducted a peer-based study to add more color to the analysis. Among my selected peers are INDY ETF (INDY), EZA ETF (EZA), ILF ETF (ILF), and EWW ETF (EWW).
Although my selected peer group has idiosyncratic differences, the set is probably prudent for investors seeking emerging growth.
Peer Analysis (Seeking Alpha)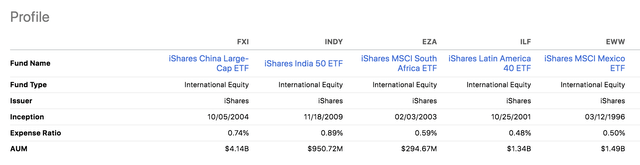
FXI ETF’s expense ratio is the second highest in the pack, likely due to its more extensive asset base. However, I think its expense ratio is noteworthy, especially considering its worst-in-class performance in the past five years.
Peer Analysis (Seeking Alpha)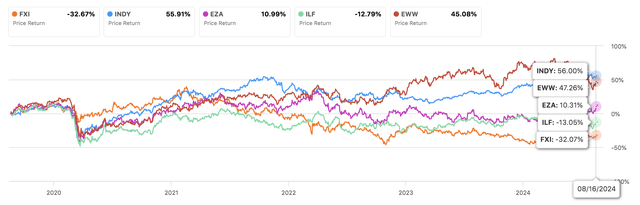
Furthermore, FXI ETF’s dividend yield of 2.6% is commendable, but similar or better yields are available via vehicles with superior price momentum.
Peer Analysis (Seeking Alpha)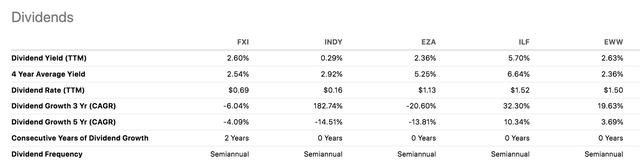
Technical Analysis/Price Activity
Having discussed numerous fundamental attributes, it is time to examine FXI ETFs’ market-based activity to illuminate an argument for price discovery.
FXI ETF has gained momentum in the past six months, surging by nearly 15%. However, the ETF slipped by about 2% in early trading on Tuesday, reflecting investors’ dissatisfaction with the data transparency and net outflow news.
Furthermore, FXI ETF trades above its 10-, 50-, 100-, and 200-day moving averages, and its relative strength index is in mid-zone territory. In isolation, this suggests that its market price could go either way.
Seeking Alpha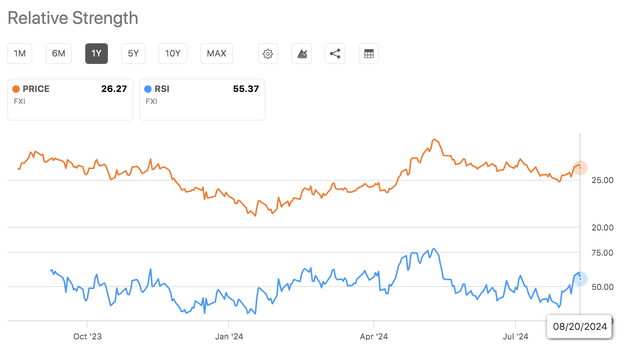
Another telling factor is FXI ETF’s Put/Call Ratio, which is at 0.87x, suggesting options traders are net bullish about the ETF’s short-term prospects.
PUT/CALL (Fintel)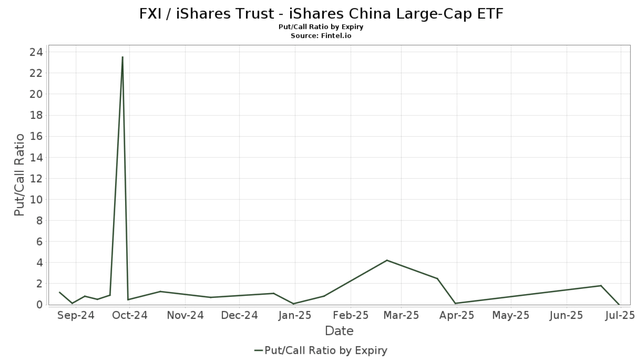
Some might disagree, but I think FXI ETF has reached a resistance level and will soon revert below its short-term moving averages. Apart from its fundamental headwinds, the Put/Call and moving-average metrics can be countercyclical, which adds substance to my argument.
Final Word
In summary, I think China’s economy faces underrated headwinds. These headwinds have influenced the FXI ETF in past years, but more pain is likely en route.
Despite hosting a few promising constituents, FXI ETF’s asset base growth is dispersed. Furthermore, the ETF faces interim challenges such as net investor outflows, data transparency, and risk within its banking sector.
Lastly, given the economic climate, I’m not fond of FXI ETF’s sectoral composition and market-based metrics. Therefore, I am cautious about the ETF’s prospects.
Credit: Source link