

Image Source
A lot of negative commentary has been recently published via articles and comments on Seeking Alpha on behalf of Schwab U.S. Dividend Equity ETF (NYSEARCA:SCHD):
- Lacking total returns
- Relative poor performance on the SPY/SCHD pair
- Slow dividend growth
- Even questioning the selection process, eliminating relative outperformers if the dividend yield falls below a specific threshold.
While some commentary is spot on, this ETF strikes a perfect defensive balance with its quality holdings.
It generally better withstands market shocks and outperforms on a relative basis during economic recessions.
This week, the market is being hit by recessionary fears as the US unemployment rate increased from 4.1% to 4.3%, sparking fear in the streets and sending shivers across all major stock markets worldwide with SPDR S&P 500 ETF Trust (SPY) down 2.5%, and Invesco QQQ Trust ETF (QQQ) lower by 3%.
Precisely, during times of increased uncertainty, one wants to own the ETF in their portfolio to offset the elevated volatility, thanks to the exposure towards traditional industries with the beta being lower than 1.0.
As SCHD’s exposure is oriented towards large-cap dividend-paying value stocks, one benefits from diversifying away from the market-weighted ETFs dominated by Mag 7 companies and 3.6% dividend yield, as deploying cash during market pullback may enhance long-term returns.
Let me show you how SCHD is the perfect fit and how one can use it in their portfolio to lower volatility and build a more robust defensive portfolio with market-beating risk-adjusted returns.
Build for Defense
Who is SCHD a perfect fit for?
Let’s first look at what you can expect from SCHD and whether it fits your investment style/portfolio:
- The ETF offers investors cheap access to quality dividend-paying stocks with an expense ratio of 0.06%. For each $10,000 invested, you pay $6 annually in management fees.
- Total Returns? No problem; since 2015, the ETF has delivered 11.4% annualized growth, compared to SPY’s 12.8% and QQQ’s 18.1%.
- With a worst-year performance of only -5.6% if you reinvested all earned dividends, compared to SPY’s worst year -18.2% and QQQ’s -32.6%, SCHD serves as a safe haven during turbulent times (as today).
- With a correlation of 0.91 to the market, SCHD provides some degree of diversification away from the Mag7-dominated market-weighted indices with lower volatility.
- If you are not European, as it does not have a UCITS alternative.
Let’s have a look at the stock selection process that is responsible for the more defensive positioning.
SCHD invests only in companies that are included in the Dow Jones U.S. Dividend 100 Index.
As the focus of the Index and ETF alike is on quality dividend-paying companies with a good track record and fundamental strength, three criteria have to be met:
- Minimum of 10 consecutive years of dividend payments
- Minimum market capitalization of $500 million
- Minimum liquidity criteria
Once a company passes the initial screening process, each one is rated based on four metrics, allocating a specific weight, with no single stock being more than 4% of the ETF, and the sector’s exposure is kept below 25% for each to enable better diversification:
- Cash flow to total debt
- Return on equity or “ROE”
- Dividend yield
- 5Y dividend growth rate
The composition of the ETF is rebalanced annually, and if one stock performs better relative to others, we can often see a higher allocation than 4%.
With over 100 holdings at a given time, the ETF is dominated by large caps oriented toward value style, contrary to most popular market-weighted, growth-oriented indices.
Investment Style (SCHD IR)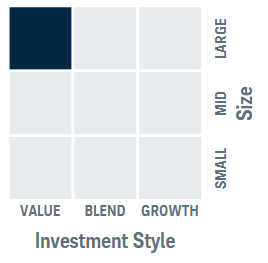
With lesser growth-oriented exposure, we won’t find many of the prominent tech names, but instead more traditional sectors, represented by 18% in Financials, 16% in Healthcare, and 15% in Consumer Defensives, with Technology being less than 9%.
Holdings by Sector (Seeking Alpha)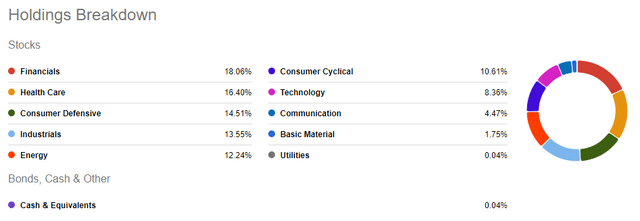
Take, for instance, SPDR S&P 500 ETF Trust (SPY), where the sector allocation is heavily tilted towards a single sector:
- 31% in Technology
- 13% in Financials
- 12% in Healthcare
- 9% in Communication Services
From my perspective, such heavy exposure to the technology sector spells trouble for any investor seeking stability and diversification, as the industry is prone to wild swings relative to the overall market, with a beta of 1.25.
If we look at SCHD’s top 10 holdings, we do not find a single Mag 7 company; no one of SPY’s top 10 holdings is represented in SCHD’s top 10. This endeavor partially explains why SCHD’s ETF did not deliver as attractive total returns as SPY’s or QQQ’s in the last few years, with Mag 7 strong performance driven by AI investment.
Before rebalancing at the beginning of this year, Broadcom (AVGO) (one of SPY’s top 10 holdings now) had been a vital part of the ETF. Yet, the stock was eliminated due to its relative outperformance, pushing down its dividend yield below the threshold.
Top Holdings (SCHD IR)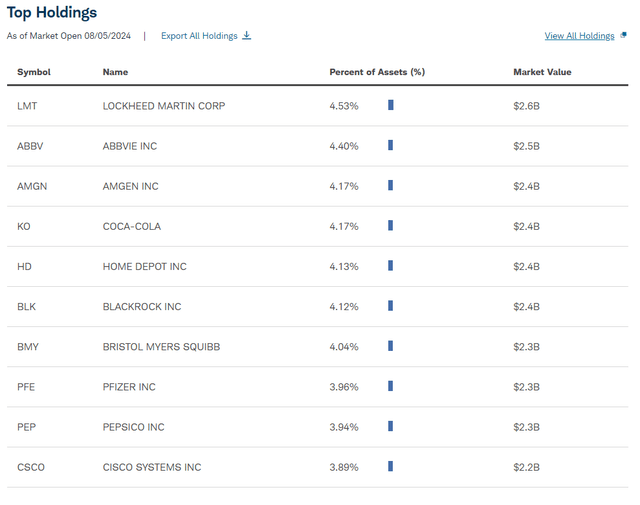
The top 10 holdings represent roughly 37% of the total ETF weight, with a well-balanced blend across various sectors.
Perhaps you are wondering why I am examining SCHD through the lens of other market-weighted indices, each with different objectives.
Ultimately, my investment style is to beat the market’s performance through a risk-conscious asset allocation, delivering attractive risk-adjusted returns within my 30-year time horizon.
SCHD is a best-in-class, dividend-oriented ETF and a better alternative to the Russell 1000 Value Index (IWD). It serves as a core holding in my portfolio and enables me to offset the heavy tech exposure of the market-weighted indices and stocks that I own.
Dividend-paying firms tend to be mature companies with healthy balance sheets that are better insulated from market volatility than highfliers or low-quality, non-profitable peers. Hence, the ETF strikes a perfect defensive stance.
While my exposure to ETF is limited to a maximum of 20% of my asset allocation, the strict selection process filters quality, which has been historically associated with market-beating returns.
Quality doesn’t come cheap, yet the ETF’s P/E valuation of 16x is significantly more competitive than SPY’s 25.7x, looking at the trailing twelve months, implying a 60% discount to the overall market.
The combination of less-premium-valued yet high-quality companies helps to better offset prolonged periods of drawdown, as we witnessed in 2022, when SPY and QQQ fell 19.5% and 33%, respectively, while SCHD fell only 6.5%.
As the ETF is focused on the quality and sustainability of dividends, the beta is below 1.0, implying less violent market movements.
Price Change (Seeking Alpha)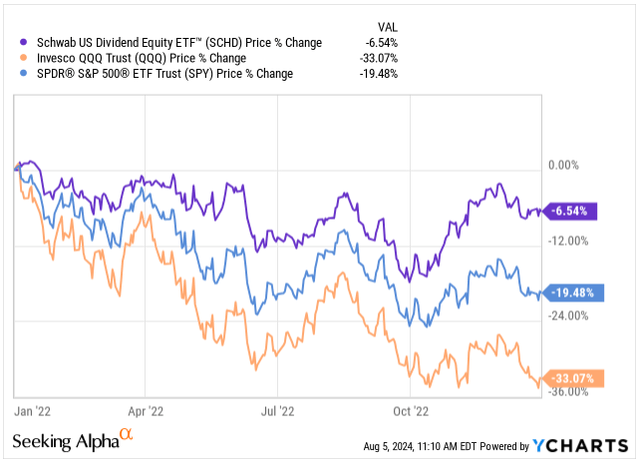
Conversely, the companies’ maturity, healthy balance sheets, and industry-leading margins in their sectors enable them to absorb market shocks better and outperform during economic slowdowns and recessions.
Naturally, one does not know whether we should expect a full-blown recession following the increased unemployment rate in the US from 4.1% to 4.3%, driving the market’s rout with SPY down 2.4% for the day and QQQ down 2.6%, or it’s just another unjustified fear in the streets.
So far, the US economy has held up well, beating other Western countries. The US reported 2.8% GDP growth in Q2, above the 2% expectation; regardless, owning SCHD in one’s portfolio provides a good cushion and better resilience.
The Golden Standard Of Distribution
It goes without saying that SCHD is the golden standard of dividend-paying ETFs.
Yet instead of risky, high-yielding stocks in its top holdings, the spots are occupied by well-established businesses with dividend yields anywhere between 2% to 4%.
Ultimately, the goal of SCHD is to deliver reliable dividend income (rather than total return, even though it was successful in both), and the strategy of annual rebalancing, eliminating high-flyers whose yields suffer as a consequence of their success, the ETF is still able to offer attractive 3.63% dividend yield.
In fact, the ETF managed to grow its dividend each year over its short history, with average dividend growth of 11.8%
Dividend Growth (Seeking Alpha)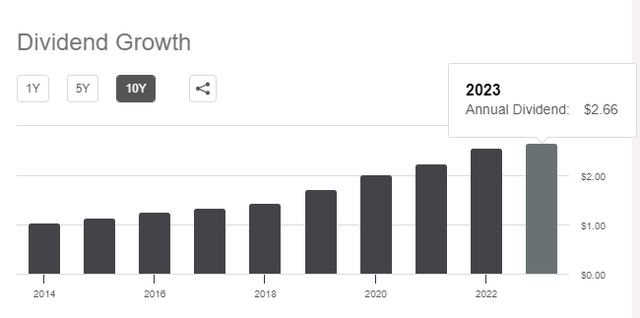
Moving forward, maintaining double-dividend growth might prove challenging as the core dividend growers, such as Broadcom and Merck & Co (MRK), were removed from the compositions, yet expecting anywhere between 7% and 9% annual dividend growth is absolutely feasible.
In addition, analysts are expecting the FED to cut rates 2 to 3 times this year to avoid a hard landing and revive the economy; with treasury yields and high-yield cash account yields falling, we can expect higher demand for dividend ETFs, potentially pushing up the price.
Takeaway
By design, SCHD is a defensive dividend-paying ETF exposed to large-cap value stocks. It generally better absorbs market shocks, with lower volatility and relative outperformance during recessions.
Owning market-weighted ETFs such as SPY or QQQ, one can significantly benefit from the diversification SCHD offers towards Financials, Healthcare, and Consumer Defensives to limit the exposure to high-flying Mag 7 companies while benefiting from the 3.6% dividend yield the ETF offers.
With a beta below 1.0, SCHD’s movements are less violent. It strikes a defensive stance and provides a cushion to each portfolio with competitive risk-adjusted returns.
Even as many criticize the ETF for lacking returns, the relative outperformance of growth stocks might not last forever. With more traditional companies being relatively cheap, one can optimize their risk.
Credit: Source link