
cemagraphics
For the third week in a row, the S&P 500 (SPY) rallied in the first half of the week only to reverse sharply into a large decline. Friday’s session already showed signs of panic. At the weekly lows, Nvidia (NVDA) was -28% from the June high and Intel (INTC) was down -30% in just one session. How ugly can this get?
We can let the market answer that for us if we pick up on the right technical signals. So far, the decline has been in-line with the expectations laid out in last weekend’s article which called for a drop to 5265. As such, I don’t think stocks are about to collapse, but risks are high and I would only buy under specific conditions.
This week’s article outlines what to look for if and when the S&P500 reaches the 5265 target. Various techniques will be applied to multiple timeframes in a top-down process which also considers the major market drivers. The aim is to provide an actionable guide with directional bias, important levels, and expectations for future price action.
S&P 500 Monthly
While markets seem to have taken a bearish turn, the monthly bar actually closed higher this week as the stats suggested it might – it’s the 10th year in a row July has closed higher. The Nasdaq, however, closed lower and ended its 16 year streak of higher July closes.
The 5522 close was inside the June bar so we can mark July down as a reversal bar. There has already been a break lower through the July low of 5390 and August is a much weaker month as we can see on Seeking Alpha’s seasonality chart.
Seasonality (Seeking Alpha)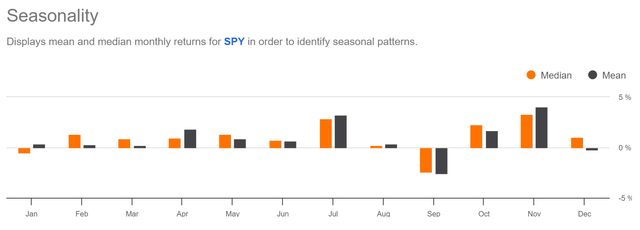
SPX Monthly (Tradingview)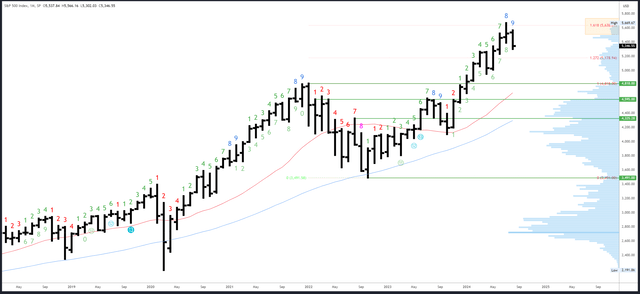
The July low of 5390 is minor resistance. 5638 and the 5669 are major resistance points above that. 5754 is the next potential target where there is a minor measured move. 6124 is a major measured move, where the 2022-2024 rally is equal to the 2020-2021 rally.
Support comes in at the 5265 area, then 4953-5000.
The August bar will complete the upside Demark exhaustion count which is already having an effect.
S&P 500 Weekly
The decline has reached the 20-week MA highlighted in the last article. This moving average marked the low in April so it is potentially important. That said, the weekly bar shows no evidence of a reversal and 5265 remains my preferred target. A lower low seems likely.
SPX Weekly (Tradingview)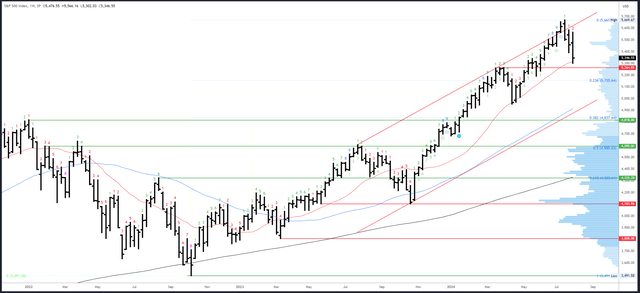
Resistance comes in at 5390-400 and 5566.
5265 is the first major support. 5191 is a level of interest below that, but there isn’t any major support until 4953 which could line up with the 50-week MA and the channel low.
A weekly upside Demark exhaustion signal has now completed and is having an effect. Next week will be bar 3 (of a possible 9) in a new downside count.
S&P 500 Daily
The daily chart is trading below the 20dma and the 50dma. The 200dma is a distant 5007.
Thursday’s “engulfing” bar and Friday’s gap down confirmed a new leg down is underway. This will be equal in length to the first leg at 5287 so the 5302 low got very close to equality.
Due to the gap down, 5383-90 still has not traded. The entire month of July and half of June has formed an “island top.” This will be invalidated by a move back over 5390, which is now a key level.
SPX Daily (Tradingview)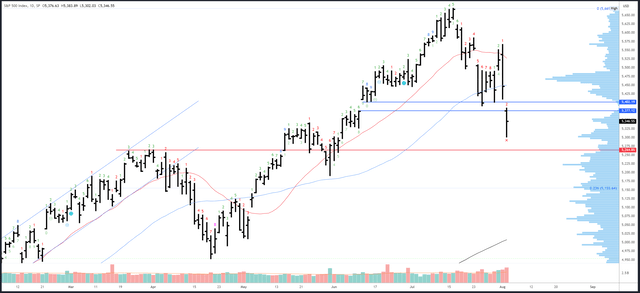
Key resistance is at 5383-400. Gap fill and the 50dma at 5446 are also potential resistance, then 5560-70.
On the downside, there is a small gap at 5291-96, which lines up with the equality target of 5287. Again, 5265 is my preferred target, but any new low under 5302 which reverses back again into a strong close above 5302 could indicate an interim bottom.
A downside Demark exhaustion will be on bar 3 (of 9) on Monday which means there can be no exhaustion signal next week.
Drivers/Events
It’s been an eventful week and everything seemed to lead up to Friday’s Jobs Report. First, the Fed made a subtle but crucial shift in focus and changed its statement from saying the committee “remains highly attentive to inflation risks” to say they are “attentive to the risks to both sides of its dual mandate.” In other words, the labor market is a real concern.
Thursday’s Unemployment Claims of 249K and weak ISM Manufacturing PMI were more red flags for the economy and Friday’s Jobs Report provided the climax. Everything was negative. Perhaps most troubling was the unemployment rate which has risen from a cycle low of 3.4% to 4.3%. The odds of a -50bps move in September have risen markedly.
One possible silver lining is labor market weakness is not a complete surprise. Chair Powell has warned several times over the last month that further easing in the labor market would be undesirable and I talked about it in last week’s article.
We may hear more concerns about the labor market and the need for lower rates to ensure a soft landing.
With the S&P500 already down -6%, at least some of the bad news is priced in.
Next week will be much quieter. ISM Services PMI is out on Monday and Unemployment Claims will be a key release on Thursday given the context. Earnings season is also quieter with no “Mag 7” stocks due to report.
The lack of news could help us gauge the market’s reaction to the Jobs Report as it could continue to have an effect early in the week.
Probable Moves Next Week(s)
2024 posted a very strong H1 and the stats (see my July 8th article) show bullish election years have excellent odds of a higher close in H2. They also highlight a correction is common with an average drawdown of-7.25%. This has nearly played out already and a -7.25% drop just happens to target 5265, which is good support.
The big picture view therefore remains bullish and the current dip is well within expectations of a correction in an ongoing trend.
That all said, the correction could run into September as a series of “fake” bottoms and large bounces are made. The first of these could come in the 5265 area.
Near-term, the decline has reached support at the 20-week MA and measured move. A quick dip to 5265 would be ideal, although the main thing to look for next week is a rejected new low under 5302 followed by a reversal higher into a strong close (near the highs of the session) back above 5302. This should lead to 5383-400. Recovering above 5400 would be a strong indication the NFP panic is over and the S&P500 can make a solid recovery to 5560.
Things could get ugly with a close below 5230-65 as 4953-5000 is the next major target. The prospect of a collapse means I will only attempt to buy the set-up described above with defined risk and stop loss.
Credit: Source link