

Dilok Klaisataporn
VTI ETF: price dip offers an entry point
My last article on the Vanguard Total Stock Market ETF (NYSEARCA:VTI) was published about 1 month ago and rated the ETF as a HOLD. As you can see from the chart below, that article was titled “VTI: Impacts From New Interest Rates Outlook” and was published on July 2, 2024. The article analyzed the advantages of a total market fund like VTI over funds based on the S&P 500 index and cautioned readers of the valuation risks in both. More specifically,
VTI offers lower valuation risks relative to SP500. The operative word is relative. VTI itself is expensively valued by historical standards. Besides the relatively lower valuation, a potential rate cut could benefit the VTI ETF more than large-cap funds like those indexed on S&P 500. In this case, mid and small-cap companies may see higher stock price increases due to their heavier reliance on debt and their better growth potential than large caps.
Seeking Alpha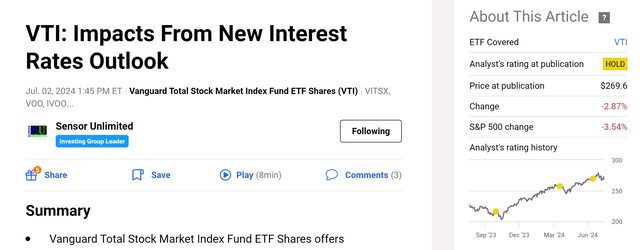
Since the publication of that article, several macroeconomic parameters have changed materially. The top changes on my list are twofold. First, many companies have reported their Q2 earnings. Combined with the recent correction in the equity market, the valuation of the fund has changed noticeably. Second, the probability curve for interest cuts has drastically changed since my last writing. As to be elaborated on later, this market now sees a 100% chance for AT LEAST two interest rate cuts by the end of 2024 (vs. about 65% only a month ago).
Given these changes, I think it is helpful to provide an updated analysis of this ETF. The remainder of this article will show why I think the ongoing price dip offers a good entry point for VTI.
VTI ETF: basic information
Before diving in, let me quickly introduce the fund. The fund seeking total-market exposure as stated in its fund description below (the emphases were added by me):
The fund seeks to track a market-cap-weighted portfolio that provides total market exposure to the US equity space. The fund is passively managed to provide vanilla exposure to approximately 100% of the US equity investable universe. It may hold large- mid-, small-, and micro-cap US-listed stocks of companies with at least $15 million market capitalization. The index is reviewed quarterly. To track the index, the fund uses a sampling strategy to approximate key characteristics including industry weights, market capitalization, and financial measures such as price-to-earnings ratio and dividend yield.
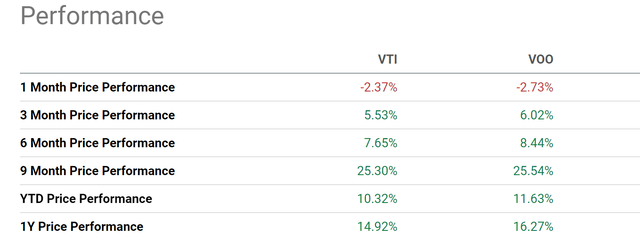
Given such broader exposure and its sampling strategy, it is difficult to obtain precise valuation data on the fund (let alone historical data). Thus, in the remainder of this article, I will rely on the valuation data of the SP500 index as an approximation for VTI. I think this approximation is accurate enough for the purpose of this article for at least two reasons. The current equity market is very dominated by a handful of mega-caps. For example, the chart below compares the concentration risks of VTI and VOO (used as an approximation to the SP500 index). VTI holds a significantly larger number of stocks than VOO as expected. However, both funds have a very similar concentration in the top 10 holdings as seen (31.28% vs 35.70%). The heavy overlap is also reflected in the close correlation between their stock prices. More specifically, the chart below compares the price returns of VTI and VOO. As seen, over the past 3, 6, and 9 months, the performance gaps between these two funds have been quite small, with VOO outperforming VTI by 0.49%, 0.89%, and 0.24%, respectively.
Seeking Alpha Seeking Alpha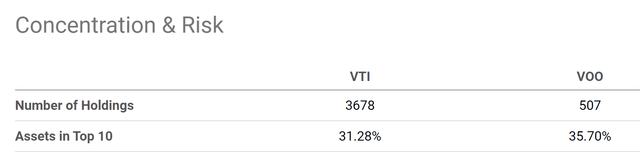
VTI ETF: 2024 return projections
Based on the above consideration, the next table shows my projections for VTI returns. As seen, due to the changes in macroeconomic parameters, I now see a return potential of 5% for 2024, in contrast to a loss of ~8% a month ago at the time of my last article. Next, I will walk through the steps involved in this forecast.
Author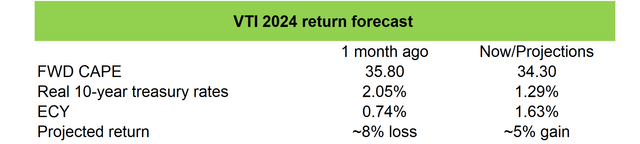
As aforementioned, the first change is the improved earnings outlook based on the Q2 earnings of the underlying companies reported thus far. More specifically, LSEG data show that:
Q2 aggregate earnings are forecasted to reach a new all-time high… Using data from the July 5th publication of the S&P 500 Earnings Scorecard, Q2 blended earnings (combining estimates and actuals) are forecasted at $492.8 billion (+10.1% y/y, +4.4% q/q, see the next chart below) while revenue is forecasted at $3,874.6 billion (+4.1% y/y, +2.1% q/q).
Given the combination of such updated earnings and the price change, my estimate is that VTI’s CAPE ratio has decreased to the current 34.3x from 35.8x a month ago.
LSEG data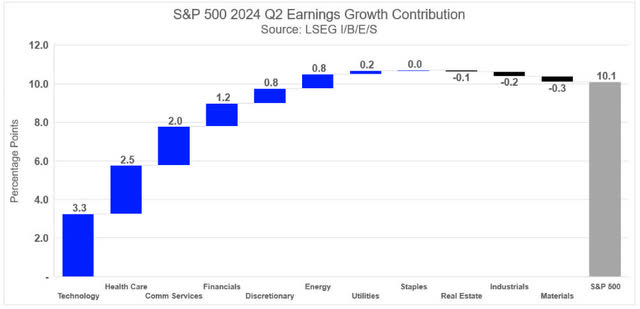
The more dramatic change in my view is the change in interest rates. To start, real 10-year treasury rates dropped from 2.05% at my last writing to the current level of 1.79% only due to cooler inflation and lower treasury rates. Secondly, the probability curve of interest cuts by 2024 has shifted substantially since my last writing. As an example, the next chart below compares the current probability curve vs. that a month ago according to federal funds’ futures contracts monitored by the CME Group FedWatch Tool. As seen, the current data points to a zero probability for either 1 rate cut or an unchanged rate (vs. about a combined 35% probability for these two scenarios a month ago). In other words, the current data also imply a 100% probability for at least two rate cuts by 2024 and about 90% probability for 3 cuts or more.
Based on the earnings and interest rates data, my above return projections are obtained in the following steps:
- I assumed the case of two cuts of 50 basis points combined. I also assumed that the 10-year treasury rates to decrease by the same amount.
- I then assumed inflation to remain at its current level. Under these assumptions, real interest rates would decrease from the current level to 1.29% by the end of 2024.
- With the FWD CAPE of 34.3x estimated above the 1.29% real 10-year yield, the ECY (excess CAPE return) from VTI is projected to be about 1.63%. A much wider spread than a month ago (only 0.74%), indicating much more favorable return potential, as elaborated on next.
CME group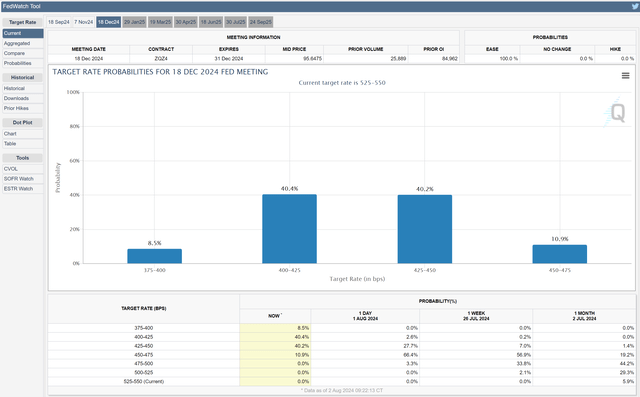
Other risks and final thoughts
The next chart (data courtesy of Dr. Robert Shiller) shows the correlation between the ECY and the return of the equity market. As seen, the correlation has been quite strong, supporting the method’s predictive power. Historically, an ECY of around 1.2% has correlated with decent (although limited) equity returns. Also note that the return plotted in the chart below is excess real return, meaning in excess of real 10-year treasury rates. Thus the notional return is better.
In terms of downside risks, first and foremost, bear in mind that ECY is only one of the many frameworks that economics has developed. Plenty of market forces can cause reality to deviate from the ECY framework, especially in the near term, such as market sentiments and/or a disruptive technology that boosts productivity dramatically (the ongoing AI infusion could be such a disruptive force). Finally, the most extreme downside risk is the case of a hard landing. But I do not (and do not suggest you) make investment decisions based on the assumption of such a scenario. My experiences have taught me that the secular trend for the U.S. equity market is up. Thus, the risks of missing out are far larger than the risks of a temporary setback in the long term.
To conclude, I see a much brighter return/risk profile for VTI now than a month ago due to two key changes in the macroeconomic parameters. First, the fund now provides a more reasonable valuation due to the combination of price corrections and new earnings forecasts. Second, the probability of multiple interest cuts by 2024 has increased drastically since my last writing. I expect these changes to widen VTI’s yield spread relative to risk-free rates and thus support a healthy return.
Shiller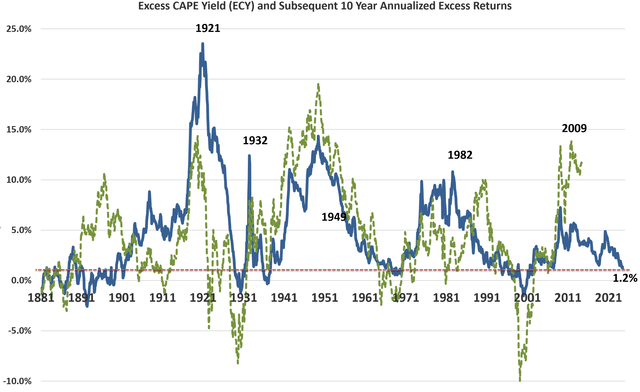
Credit: Source link