

blackred
The latest job openings and labor turnover summary (JOLTS) report showed that job openings inched down in June. Vacancies decreased to 8.184 million in June from May’s upwardly revised level of 8.230 million. The latest reading was above the expected 8.020 million vacancies.
From the press release:
The number of job openings was unchanged at 8.2 million on the last business day of June, the U.S. Bureau of Labor Statistics reported today. Over the month, both the number of hires and total separations were little changed at 5.3 million and 5.1 million, respectively. Within separations, quits (3.3 million) and layoffs and discharges (1.5 million) changed little. This release includes estimates of the number and rate of job openings, hires, and separations for the total nonfarm sector, by industry, and by establishment size class.
Background on JOLTS (Job Openings and Labor Turnover)
The JOLTS report is a monthly survey of job openings, hiring, and job separations (quits, layoffs, discharges) released by the BLS. Unlike the unemployment rate that measures the supply side of the labor market, JOLTS data helps gauge labor demand.
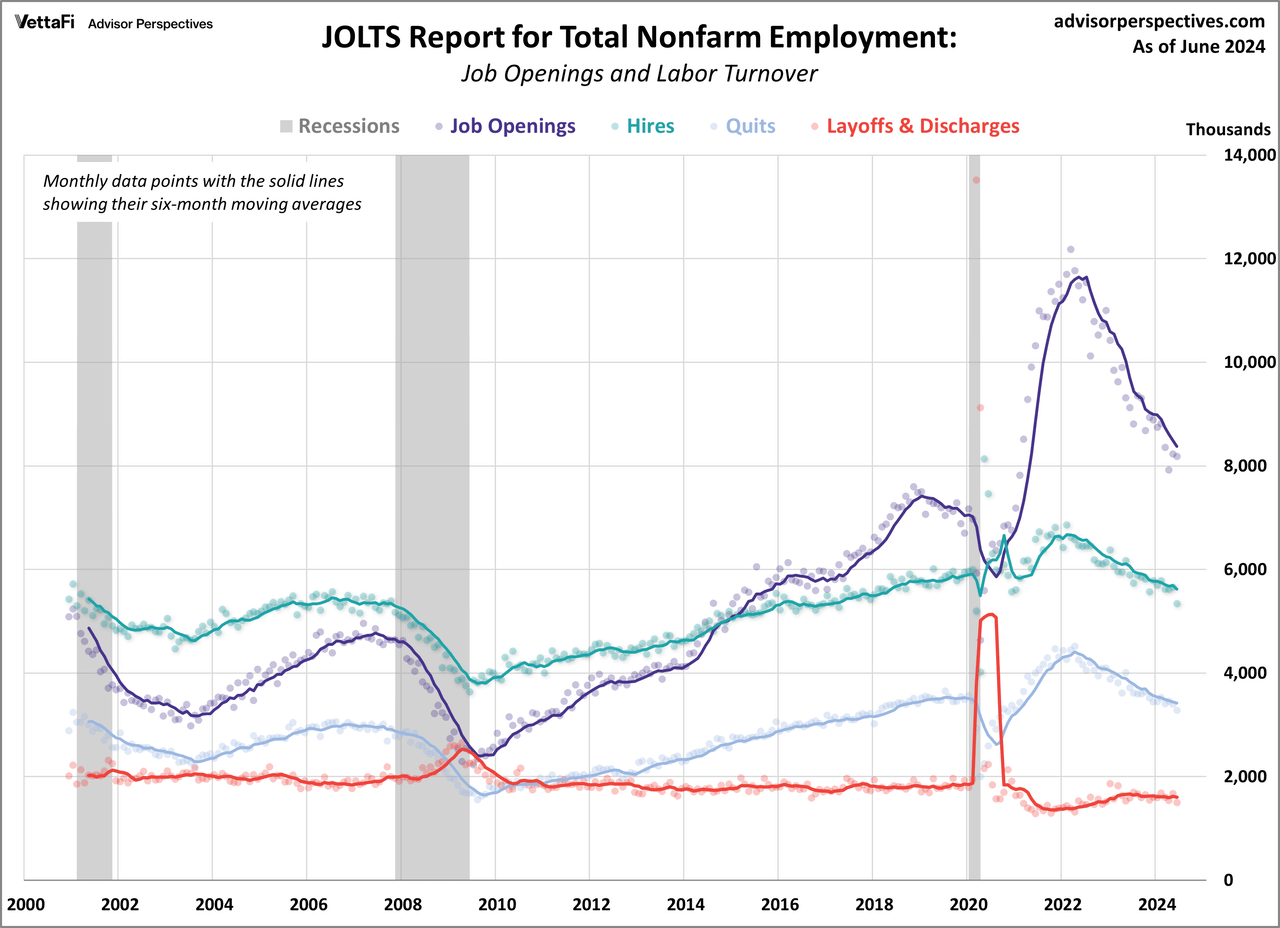
The chart below shows the monthly data points of the four components of the JOLTS series. They are quite volatile, hence the inclusion of six-month moving averages to help identify the trends. The moving average for openings was above the hires levels for over five years starting in 2015, as seen in the chart below.
The openings MA briefly dipped below the hires for two months (May and June 2020), only to climb above once more in July 2020. Over the last year, job openings, hires, and quits have all been trending down with job openings falling the fastest. During that same time, layoffs and discharges have been slowly trending up but have recently started to level off.
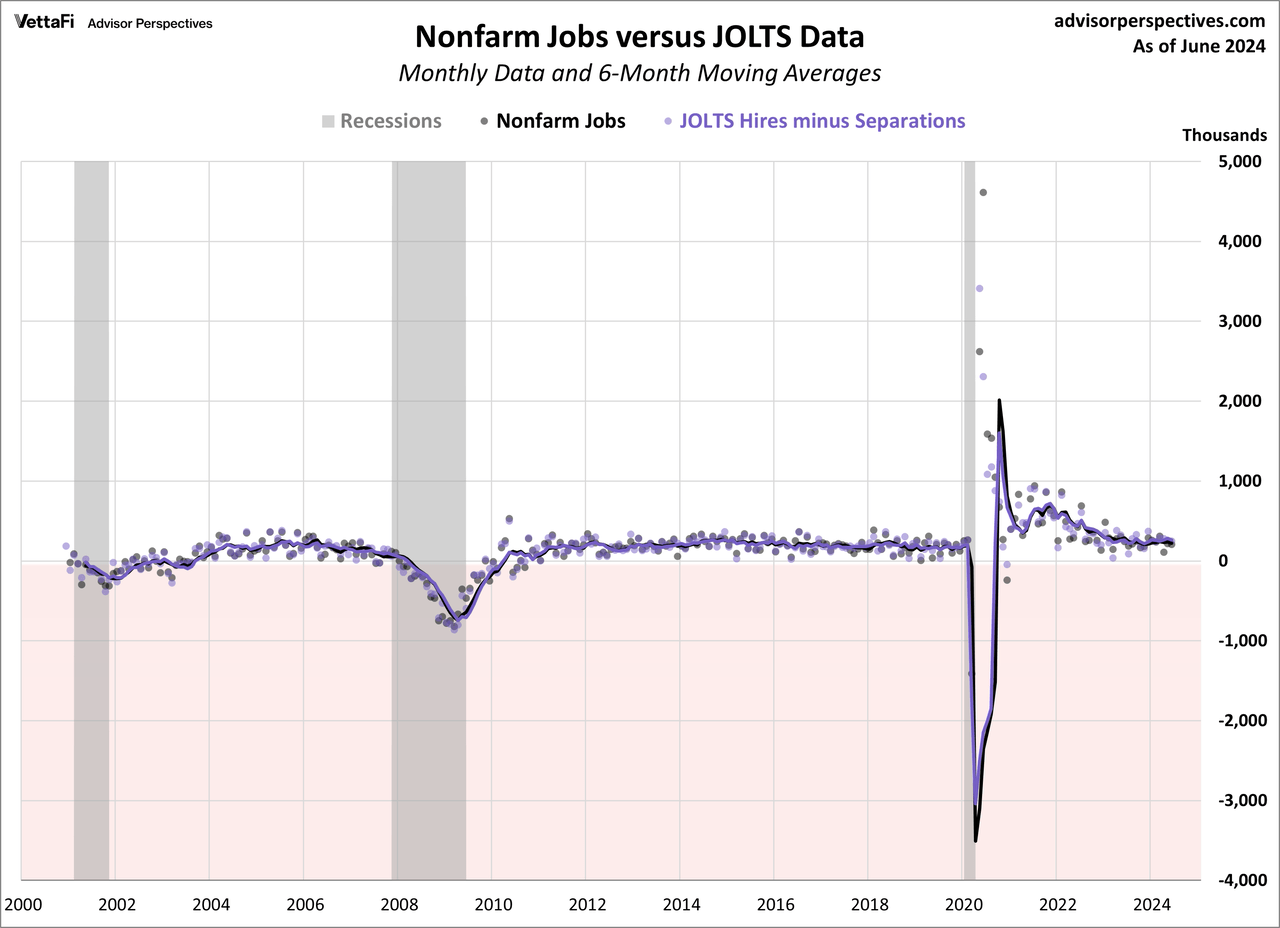
For comparison, here is the monthly BLS Employment Situation Summary charted with JOLTS data:
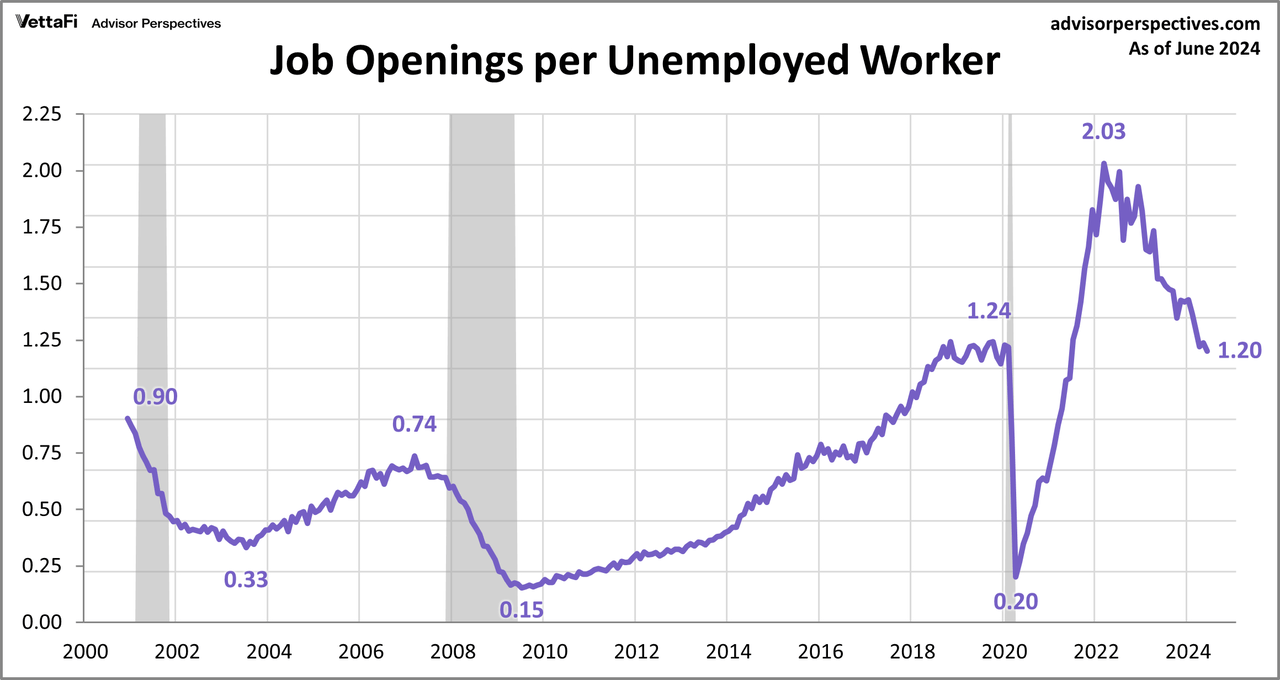
In June, there were 6.811 million unemployed workers and 8.184 million job openings. This equates to 1.20 jobs available per unemployed worker in June, down from May. This is the lowest ratio level since June 2021.
 A Population-Adjusted Perspective on JOLTS
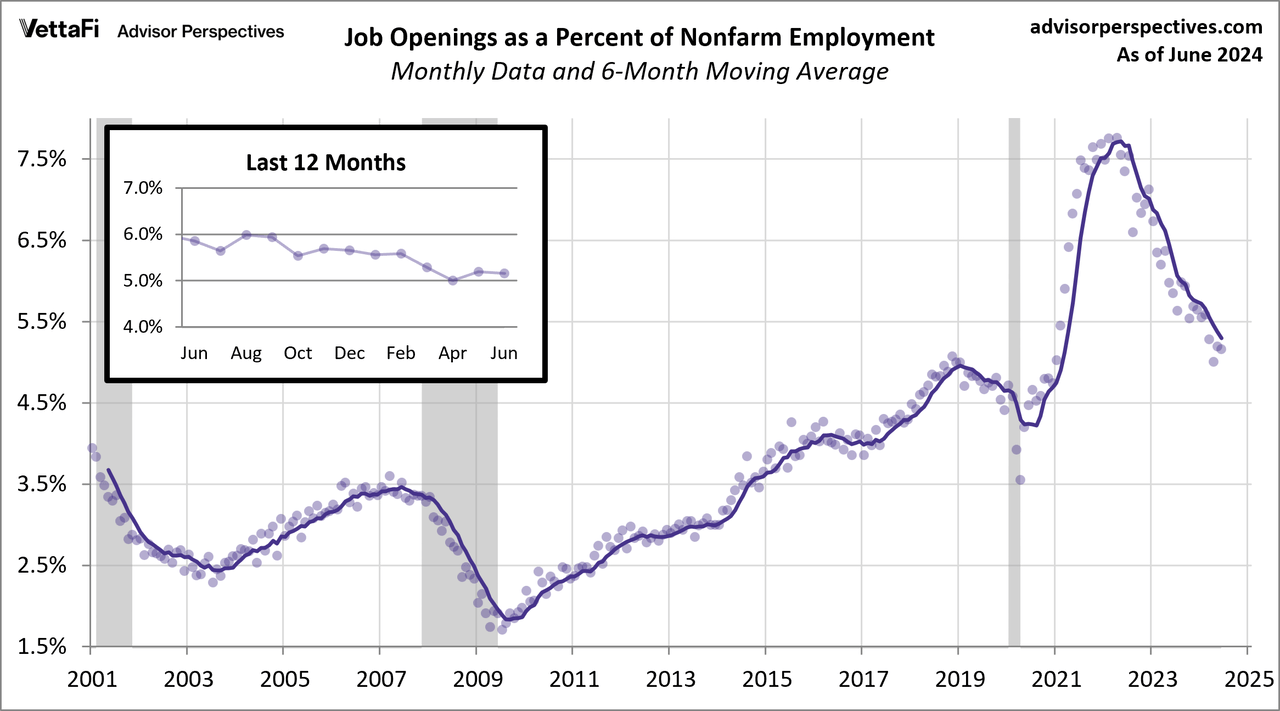
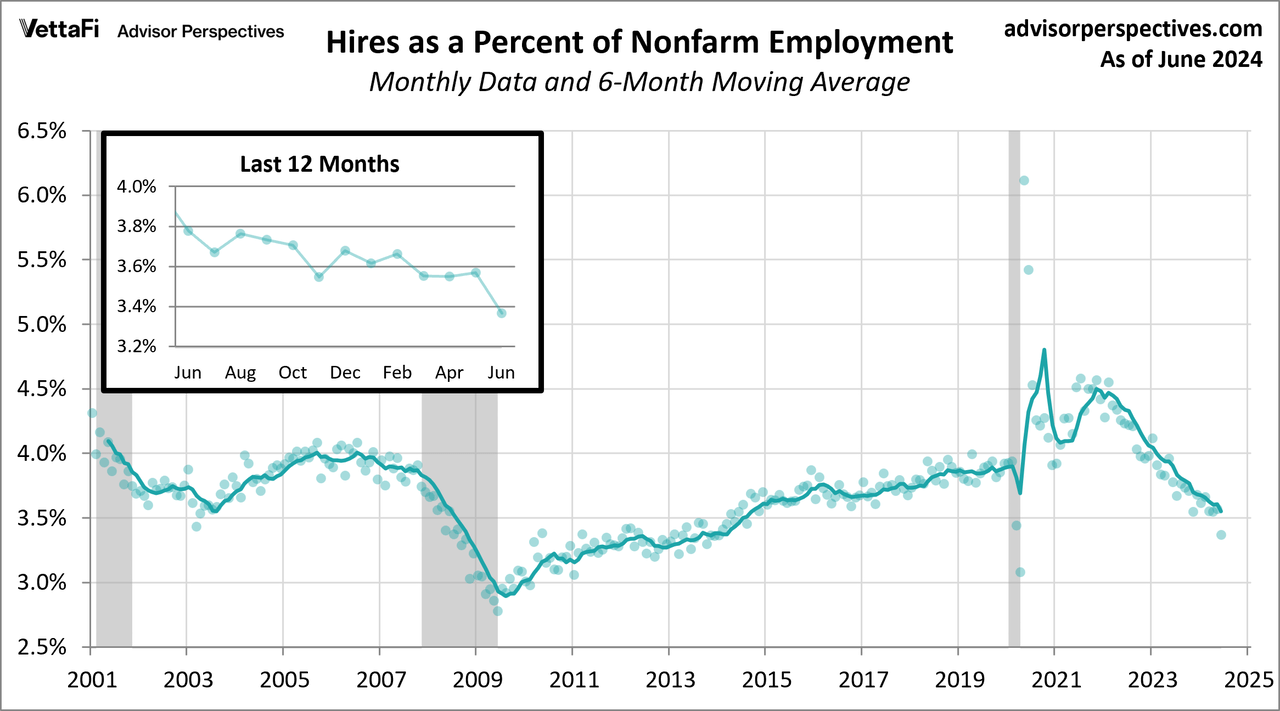
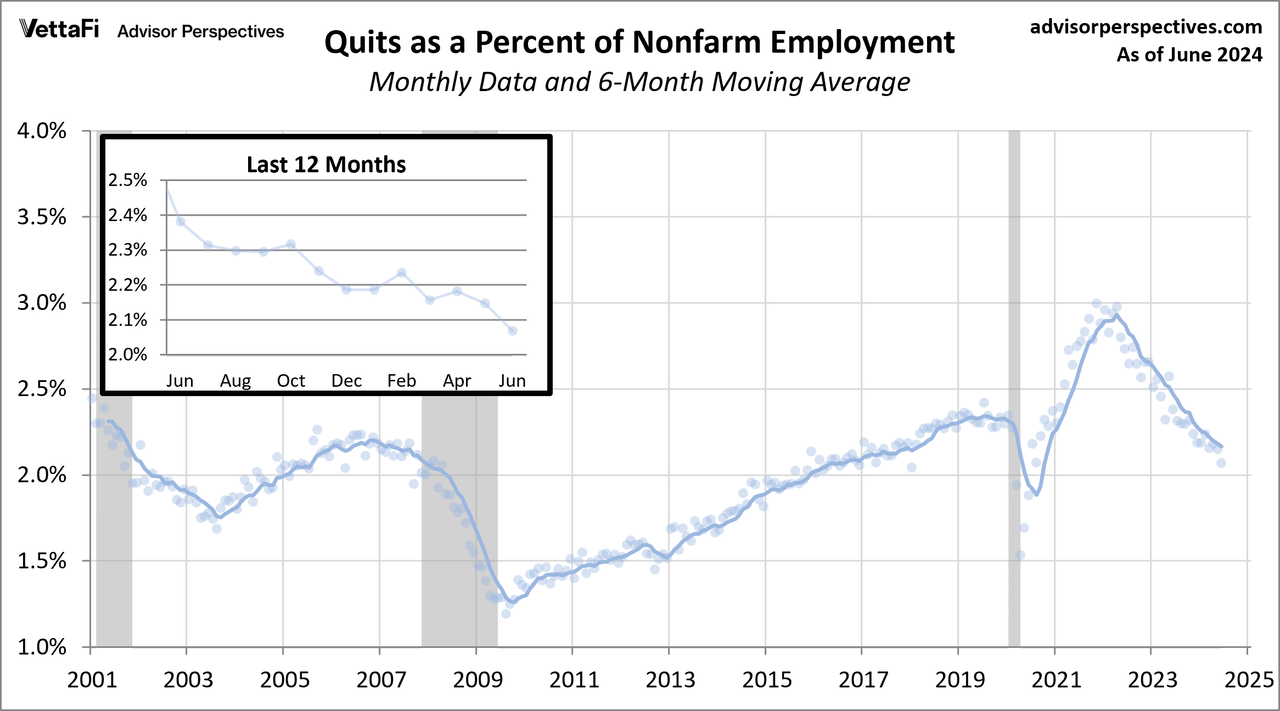
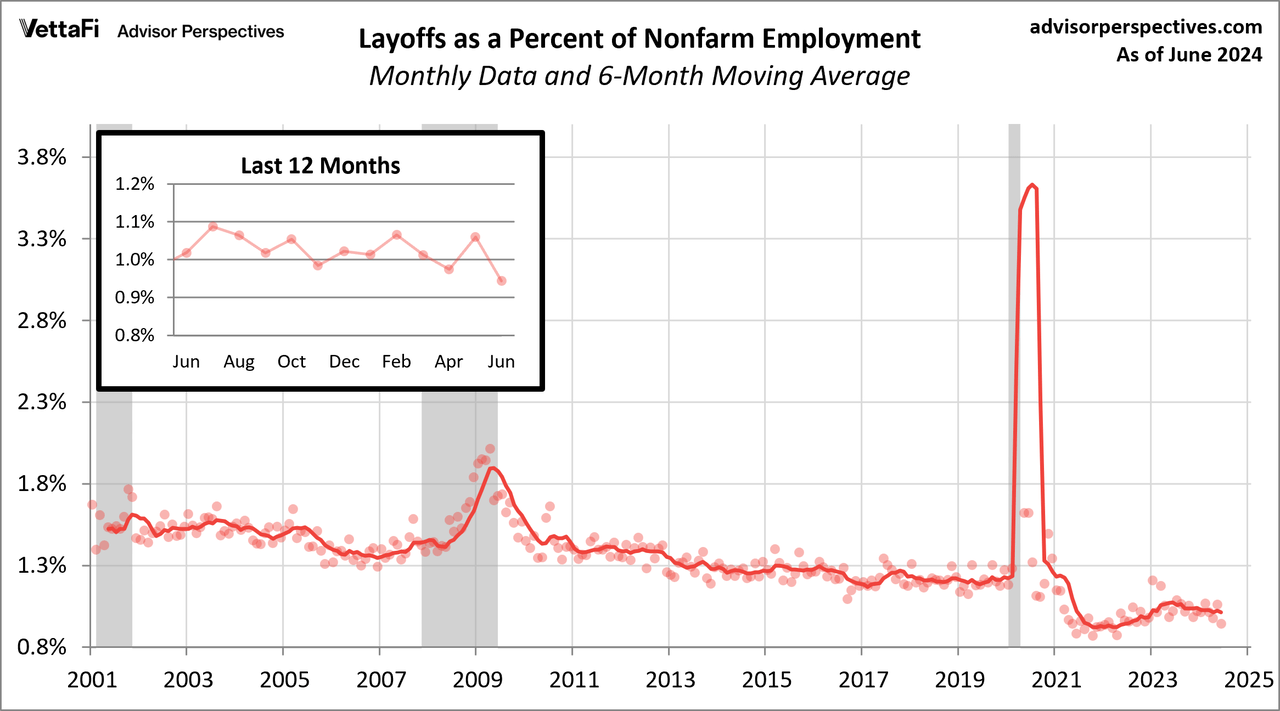
The chart above is based on the actual numbers in the JOLTS report. A better way to view the numbers is as a percent of non-farm employment, which essentially gives us a population-adjusted version of the data. Here is that adjustment for four of the JOLTS series. The vertical axis for each is optimized for the high-low range to facilitate an understanding of the individual trends.
On the last business day of June, the number of job openings was unchanged at 8.2 million and was down by 941,000 over the year. The job openings rate held at 4.9 percent in June. Job openings increased in accommodation and food services (+120,000) and in state and local government, excluding education (+94,000). The number of job openings decreased in durable goods manufacturing (-88,000) and in federal government (-62,000).
The number of hires was little changed at 5.3 million in June but was down by 554,000 over the year. The hires rate, at 3.4 percent, changed little in June.
In June, the number of quits was little changed at 3.3 million but was down by 434,000 over the year. The quits rate was unchanged at 2.1 percent in June. Quits decreased in construction (-64,000) and in state and local government education (-55,000).
In June, the number of layoffs and discharges changed little at 1.5 million, and the rate decreased to 0.9 percent. Layoffs and discharges decreased in finance and insurance (-26,000).
The Business Cycle and JOLTS
Based on the six-month moving averages, we can see that:
- The job openings moving average is above the hires levels.
- Job openings are below their all-time high and trending down, but remain above pre-pandemic levels.
- Hires are below their all-time high, trending down, and have reached pre-pandemic levels
- Quits are below their all-time high, trending down, and have reached pre-pandemic levels.
- Layoffs and discharges have leveled off but remain below pre-pandemic levels.
The trend in quits
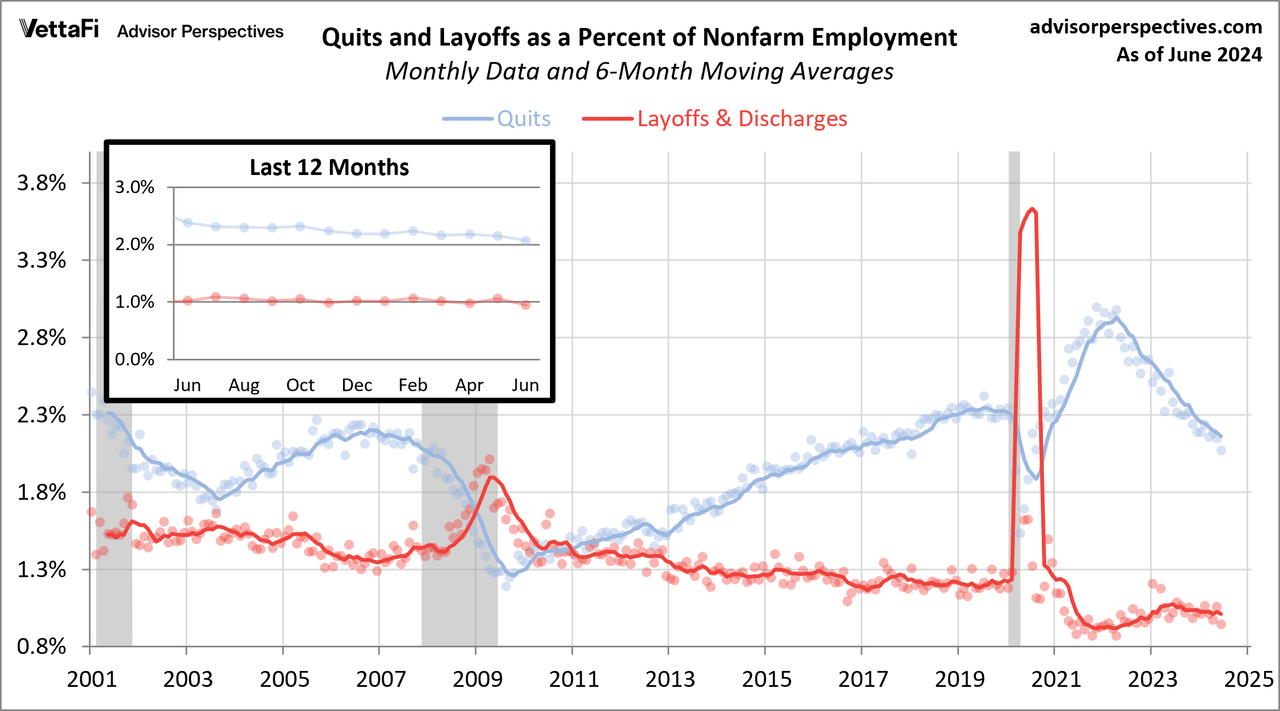
To reiterate a previous point: Increases in quits suggest employment flexibility. Quits tend to be inversely correlated with layoffs & discharges, which are associated with business cycle weakness. Following the Great Recession, quits began increasing in 2010, and the rate accelerated in 2013 and continued to rise until the COVID pandemic.
As the economy rebounded from the COVID downturn, we saw quits reach an all-time high in November 2021 and again in March 2022 in what has been called “The Great Resignation”. Layoffs & discharges fell post Great Recession and leveled out for many years. Due to the COVID pandemic, layoffs and discharges saw all-time highs but are now making their way back to pre-pandemic levels.
It would, of course, be excellent if we had historical JOLTS data stretching back through several business cycles. However, the BLS only began tracking this data in December 2000.
The time frame is quite limited compared to the main BLS data series in the monthly employment report, many of which go back to 1948, and the enormously popular non-farm employment (PAYEMS) series goes back to 1939. Nevertheless, there are some clear JOLTS correlations with the most recent business cycle trends.
The JOLTS reports are interesting to watch, but the volatility of the data, which is also subject to revisions, encourages caution in taking the data for any given month very seriously.
Original Post
Editor’s Note: The summary bullets for this article were chosen by Seeking Alpha editors.
Credit: Source link